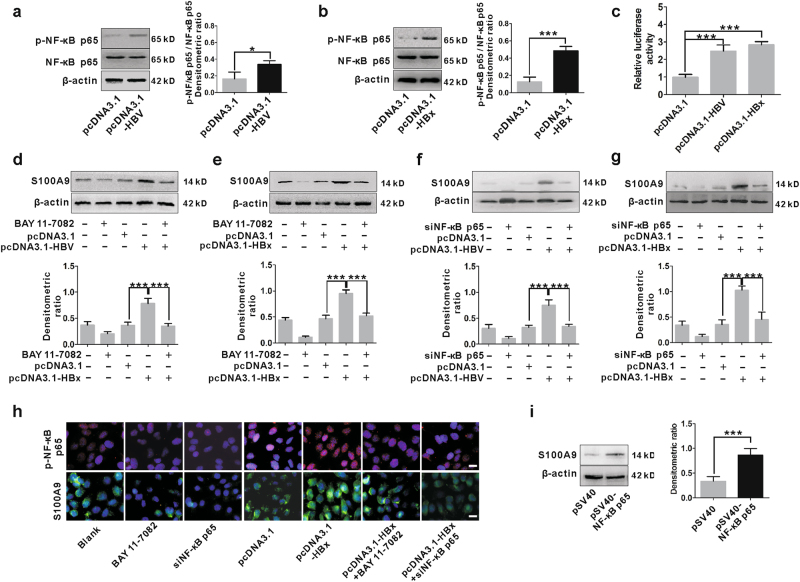
Fig. 3. Regulation of S100A9 expression by HBx-mediated NF-κB signaling activation.
a, b Western blot analysis for p-NF-κB p65 levels in HepG2 cells transfected with pcDNA3.1-HBV (a) or pcDNA3.1-HBx (b) and its control pcDNA3.1 for 48 h. Total NF-κB p65 and β-actin were included as the loading controls. The densitometric ratios were compared to the controls and then normalized to the β-actin and were shown on the right panel, respectively. c Dual luciferase reporter assay analysis for transcriptional activity of NF-κB in HepG2 cells co-transfected with pcDNA3.1 or pcDNA3.1-HBV or pcDNA3.1-HBx and luciferase reporter vector (p-Luc-NF-κB). Plasmid RL-TK was also co-transfected to normalize transfection efficiency. Luciferase activity was measured 48 h after transfection. d, e HepG2 cells were transfected with pcDNA3.1-HBV (d) or pcDNA3.1-HBx (e) followed by treatment with NF-κB inhibitor BAY 11-7082 (5 μM) for 48 h. The protein levels of S100A9 were analyzed by western blot. The relative expression of S100A9 is quantified by densitometric ratios and is shown below. f, g HepG2 cells were transfected with pcDNA3.1-HBV (f) or pcDNA3.1-HBx (g) followed by treatment with siNF-κB p65 for 48 h. The protein levels of S100A9 were analyzed by western blot and quantified by densitometric ratios. h Immunofluorescence staining for p-NF-κB p65 and S100A9 in HepG2 cells transfected with pcDNA3.1-HBx followed by treatment with BAY 11-7082 (5 μM) or siNF-κB p65 for 48 h. White scale bars = 10 μm. i Western blot analysis of S100A9 in HepG2 cells transfected with pSV40-NF-κB p65 and its control pSV40 for 48 h. β-Actin was included as the loading control. The densitometric ratios were compared to the controls and then normalized to the β-actin and were shown on the right panel; *p < 0.05, ***p < 0.001

