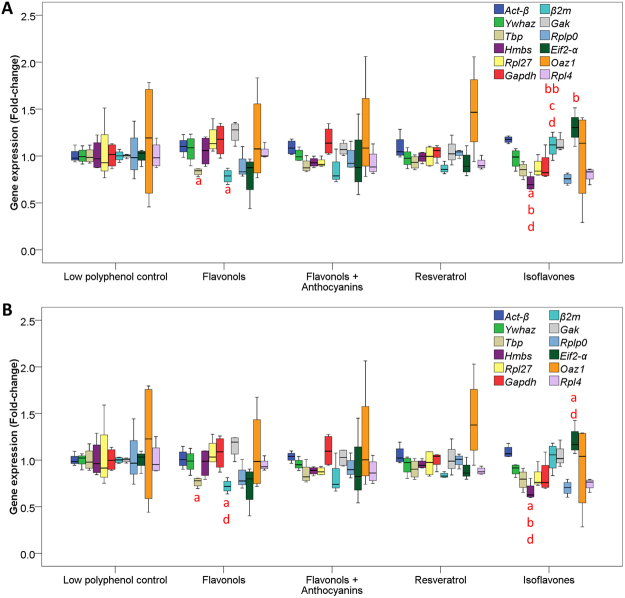
Figure 5.
Box and whisker plots of gene expression differences between polyphenol treated groups of ApoE−/− mice. (A) Gene expression normalised to Act-β, Tbp and Ywhaz. (B) Gene expression normalised to Act-β, and Ywhaz (single letter symbols mean P = 0.05 and double letter symbols mean P ≤ 0.01, adifference from control, bdifference from flavonol, cdifference from flavonol + anthocyanins and ddifference from resveratrol). Data presented as median, upper and lower values and interquartile ranges.

