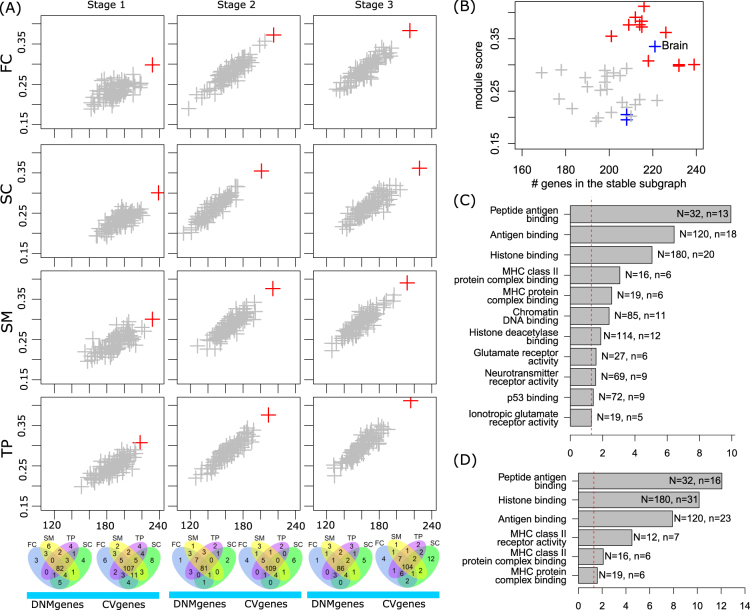
Fig. 4. Schizophrenia subnetwork analysis.
a Comparison of the stable subnetwork obtained in each of the 12 spatiotemporal points (red) with 100 random subnetworks (gray). X-axis: the number of genes of interest (i.e., the union of DNMgenes and CVgenes) in the stable subnetwork; y-axis: score of the subnetwork (see main text for details). In each panel, the 100 random subnetworks were identified using random seed genes in the same size as our genes of interest and were obtained using the same method. Comparison of the DNMgenes and CVgenes in the stable subnetwork is shown in Venn diagrams. b Comparison of the 12 subnetworks obtained using 12 spatiotemporal brain data from BrainSpan Atlas (red) with subnetworks obtained using GTEx tissue-specific expression. The GTEx brain, nerve, and pituitary are shown in blue while other tissues are shown in gray. c Gene Ontology enrichment analysis of component genes in FC, stage 1. Significantly enriched (pBonferoni < 0.05) Gene Ontology Molecular Function were obtained using ToppFun. d Gene Ontology enrichment analysis of the original genes of interest, i.e., the union of DNMgenes and CVgenes

