Fig. 4.
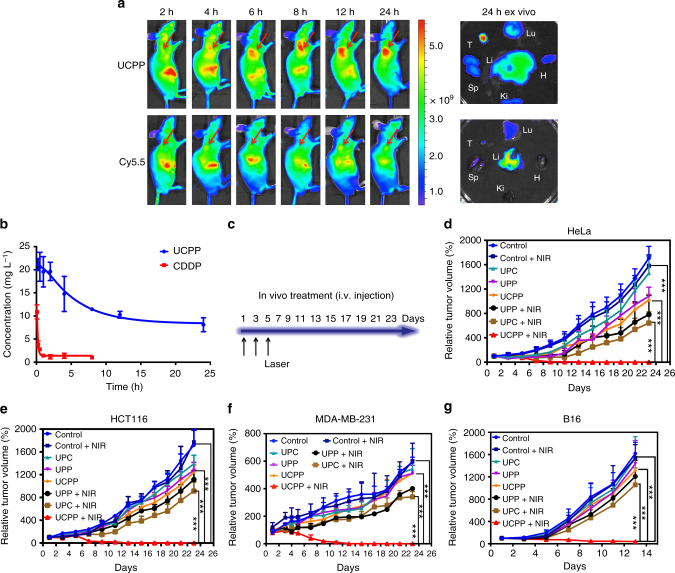
In vivo behavior and antitumor activity of UCPP. a In vivo fluorescence imaging of UCPP at different time points after intravenous injection. The right column shows ex vivo fluorescence images of major organs and tumor striped from those mice at 24 h after intravenous injection (red arrows indicates the locations of tumors) where T, H, Li, Sp, Lu, and Ki stand for tumor, heart, liver, spleen, lung, and kidney, respectively. b Profiles of plasma concentration vs. time using UCPP nanoparticles and free CDDP (a dose of 1 mg cisplatin per kg body weight). Data were shown as mean ± S.D. (n = 4). c Schematic illustration of in vivo antitumor treatment. d–g Tumor volume of HeLa, HCT116, MDA-MB-231, and B16 tumor-bearing mice after treating with PBS (blue), PBS + NIR (deep blue), UPC (cyan), UPP (purple), UCPP (orange), UPP + NIR (black), UPC + NIR (brown), and UCPP + NIR (red). Data were shown as mean ± S.D. (n = 5). P values by comparing the UCPP + NIR group with other control groups were calculated by two-tailed Student’s t-test (***p < 0.001, **p < 0.01, or *p < 0.05)

