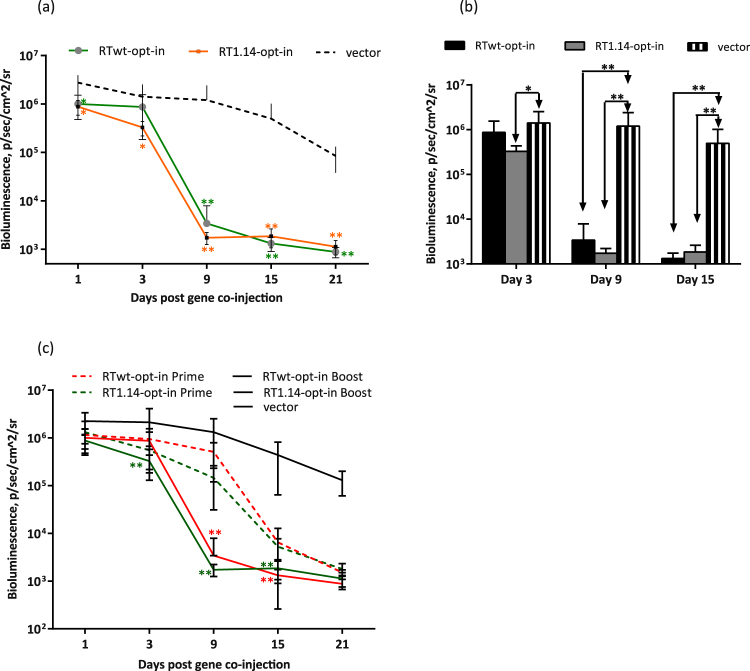
Figure 4.
Effector immune response evaluated in vivo by “antigen challenge” in a prime-boost Luc/RT immunization of mice. BALB/c mice (n = 6) were immunized with two intradermal injections (29G needle) containing 40 µg RTwt-opt-in or RT1.14-opt-in encoding plasmids per mouse with subsequent electroporation by Dermavax (standard protocol) and 4 weeks later boosted with 20 µg of the same RT genes per mouse mixed 1:1 (w/w) with a Luc-encoding plasmid. Control mice received empty vector as a prime and a vector/Luc gene mixture as a boost. The emitted bioluminescence was monitored on days 1, 3, 9, 15, and 21 after boosting (a,b). Comparison of photon flux exhibited by mice primed with Luc/RT (Supplementary Fig. S4) or primed with RT and boosted with Luc/RT gene variants (c). Each curve (a,c) or bar (b) represents the average photon flux (photons/s/cm2/sr) from the injection area observed for the group of six mice (12 immunization sites), and the error bars represent the SD. The difference in photon flux between RT- and vector-immunized mice (a,b) and between prime and prime-boost groups of RT-immunized mice (c) is indicated by *p < 0.05 or **p < 0.01. In (a,c) the asterisk color matches the curve color. Statistical comparisons were performed using Mann–Whitney tests.

