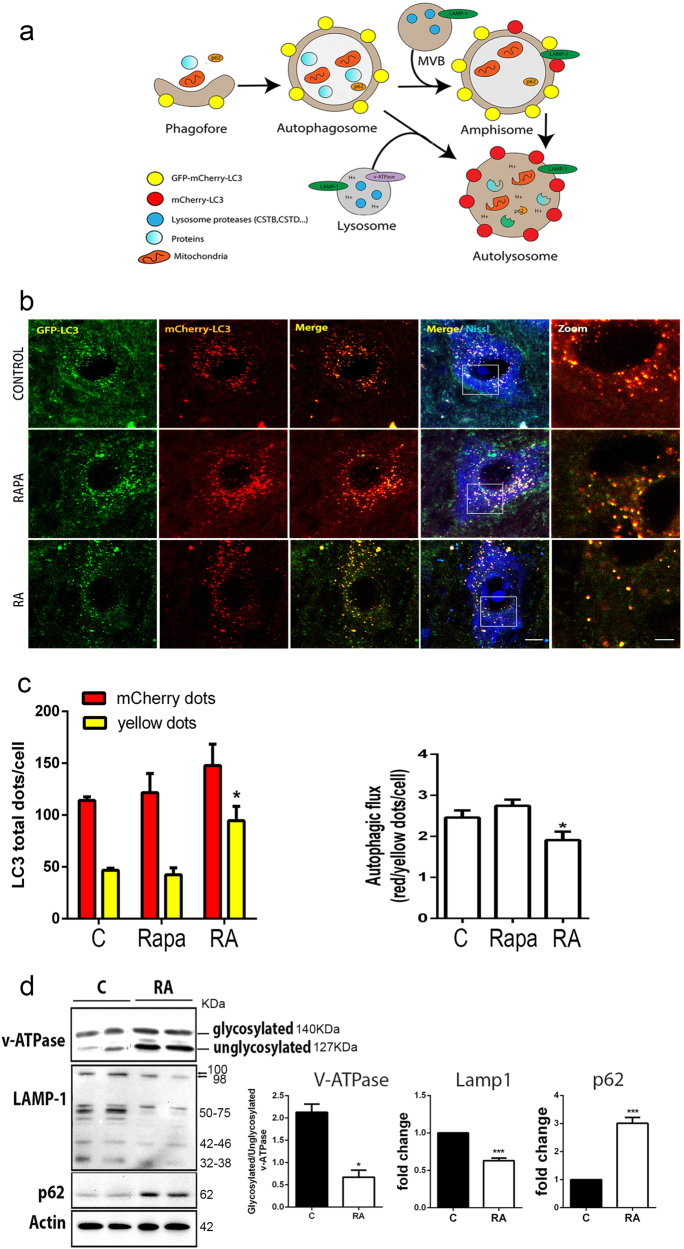
Fig. 1. Impaired autophagy flux and aberrant lysosomal protein glycosylation after RA.
a Schematic representation of the autophagy flux (modified from ref. 13). Expression of the mCherry-GFP-LC3 reporter gene will generate yellow puncta upon activation of autophagy at the autophagosome/amphisome and red puncta in the autolysosome if the autophagy flux continues correctly and the lysosomes achieve their usual acidic pH which quenches the green GFP fluorescence. b Microphotographs of representative MNs from sham-operated control animals treated with rapamycin (Rapa) for 3 days before sacrifice, from RA injured and control sham rats at 5 dpi; all rats were infected with AAVrh10-mCherry-GFP-LC3. c Left, Bar graph of manual quantification of yellow and red puncta within MNs at L4 spinal cord segment in both conditions. Right, Bar graph of autophagic flux measured as the ratio of red to yellow puncta per MN. Non-parametric t-test was used to compare the statistical significance between the control and avulsed animal. d Left, Immunoblot for glycosylated and unglycosylated v-ATPase, LAMP1, and p62. Note the slight difference in electrophoretic mobility of higher LAMP1 band between control and RA samples and the different general band pattern. Right, Bar graph showing the average fold change protein level ± SEM in control (C) and root avulsed (RA) samples normalized to actin levels (n = 4). Scale bar = 10 µm; zoom = 5 µm; *p < 0.05 vs. control, ***p < 0.001 vs. control (Student’s t-test)

