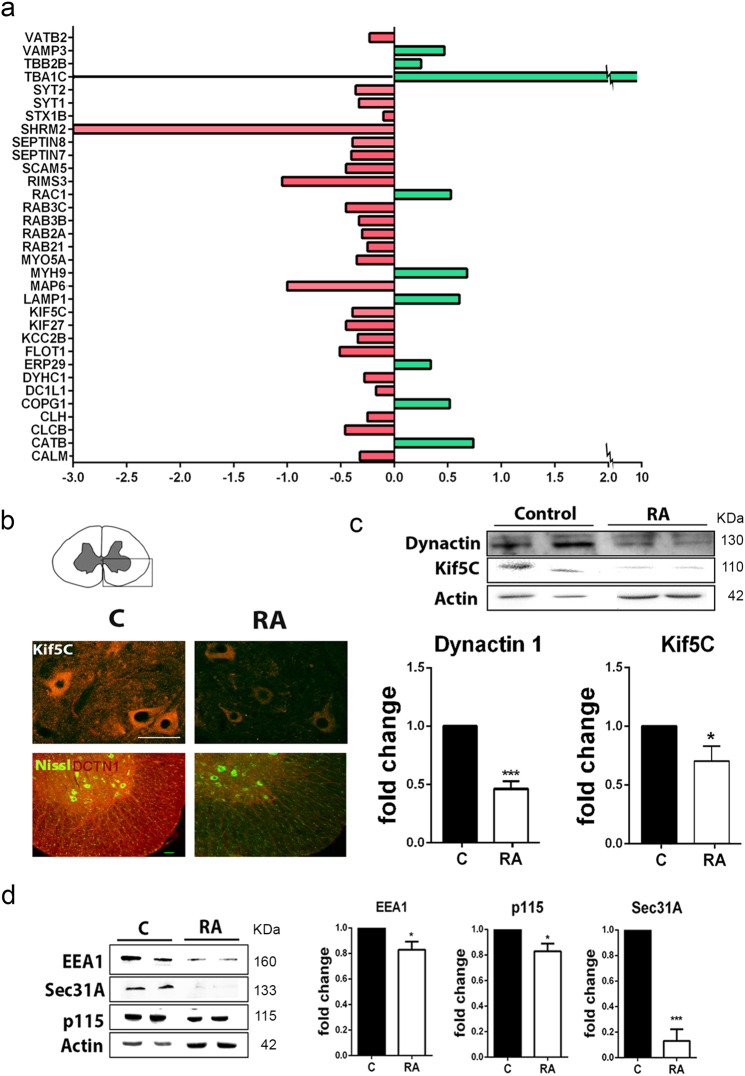
Fig. 2. Proteomic data validation.
a Histogram of microtubule and vesicle-related protein fold changes in RA injured L4–L5 spinal cord segments with respect to sham-operated control obtained by analysis of proteomic data (upregulated in green; downregulated in red) obtained previously7. b Microphotographs of the ipsilateral spinal cord ventral horn from control (C) and RA-injured (RA) animals, showing immunostaining of KIF5C and DCTN1 with fluorescent Nissl counterstaining to reveal MNs at 7 dpi. Scale bar = 100 µm. c Western blot to quantify KIF5C and DCTN1 (n = 4; *p < 0.05 vs. control, ***p < 0.001 vs. control Student’s t-test). d Immunoblot and bar graph showing the analysis of EEA1, Sec31A, and p115 protein levels in L4 spinal cord segments (n = 4; *p < 0.05 vs. control, ***p < 0.001 vs. control Student’s t-test)

