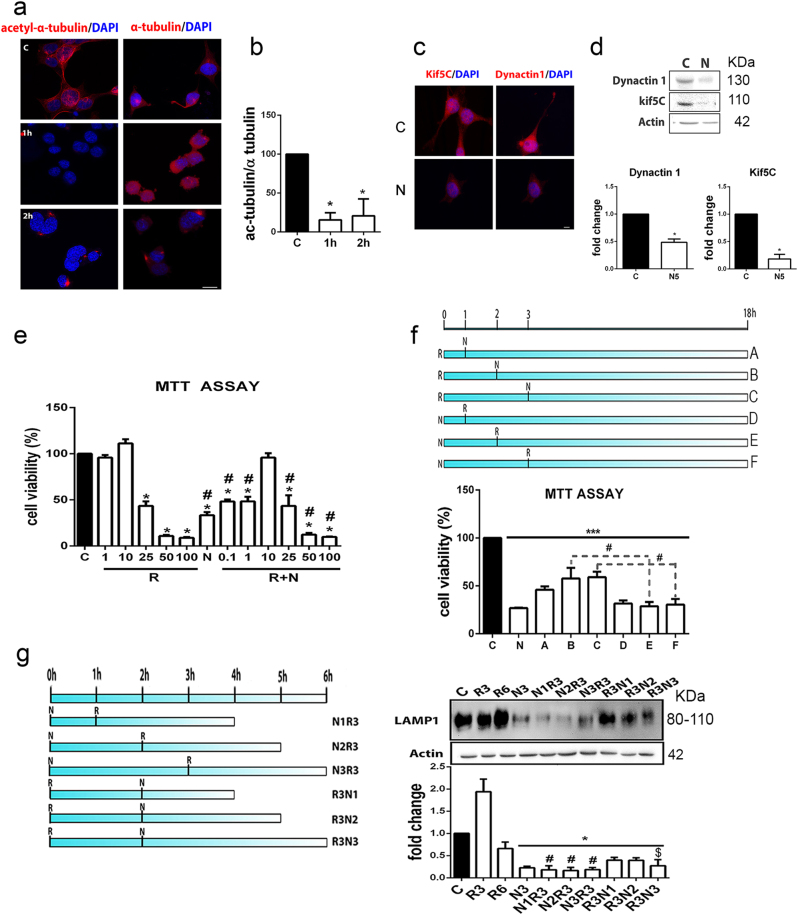
Fig. 3. In vitro model characterization.
a Microphotographs showing merged images for α-acetyl-tubulin and α-tubulin fluorescent immunostaining (red) with DAPI nuclei counterstaining (blue) in control (C) NSC34 cells and cells treated with 10 µM nocodazole (N) for 1 h and 2 h. b Bar graph of ratios of mean immunofluorescence intensities (± SEM) of the acetylated vs. non-acetylated forms of α-tubulin (*p < 0.001 vs. control, one-way ANOVA). c Representative images of KIF5C and DCTN1 fluorescent immunostaining (red) with DAPI counterstaining (blue) in control cells and cells treated for 5 h with nocodazole. d Immunoblots and histograms of the levels of DCTN1 and KIF5C in control and nocodazole-treated cells (n = 3; *p < 0.05 vs. control). e Bar graph of the mean average percentage of NSC34 cell survival 18 h after vehicle (C), 1 µM rapamycin (R), 10 µM nocodazole (N), and concomitant R+N treatments analyzed by MTT assay (n = 4; *p < 0.001 vs. control, one-way ANOVA). f Schematic of different culture conditions assayed where either R was added at the beginning of the experiment and N was added after 1, 2, or 3 h (A, B, C conditions) or the reverse (D, E, F conditions). After 18 h of each condition, cell survival was assessed by MTT. g Left, Schematic of culture conditions. N was added at time zero and R was added after 1, 2, or 3 h (N1-N3R3) or the reverse (i.e., R was added at time zero and N was added after 1, 2, or 3 h; R3N1-N3). Cells were harvested at 6 h. Right, Immunoblot and histogram of LAMP1 protein levels in cells treated as described in g (n = 3–5; *p < 0.05 vs. control, $p < 0.05 vs. R6, #p < 0.05 vs. R3, one-way ANOVA)

