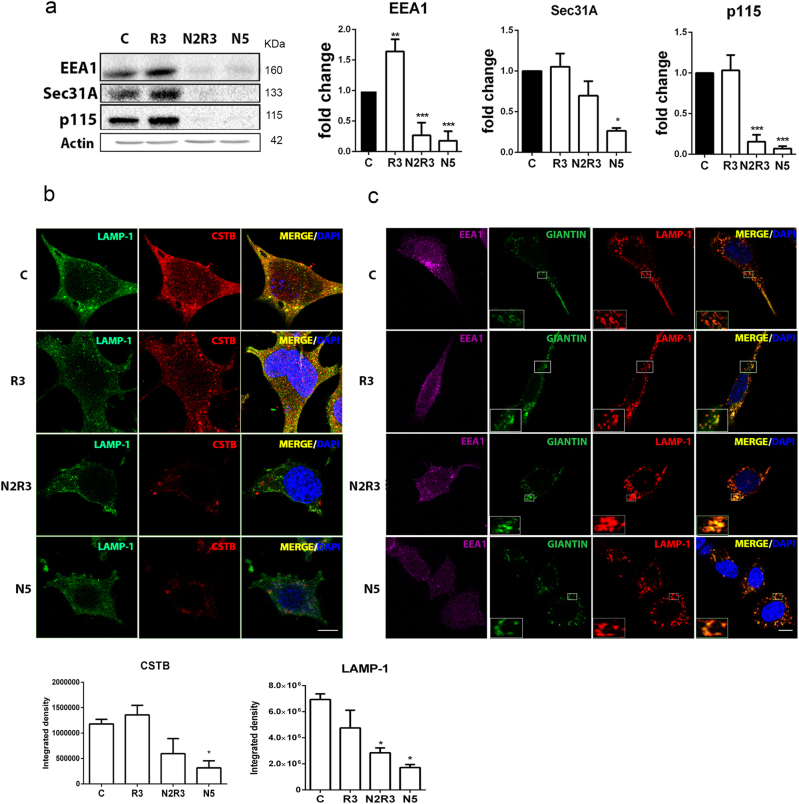
Fig. 4. Alterations in protein trafficking in the in vitro model.
a Immunoblots and histogram showing the levels of EEA1, Sec31A, and p115 in control NSC34 cells and in cells treated with nocodazole (N), rapamycin (R), or the sequential combination (N2R3). b Microphotographs showing LAMP1 (green) and CTSB (red) immunostaining and co-localization (merged images) in indicated conditions. Below, graph bars of immunofluorescent quatification for each marker. Scale bar = 15 μm. c Representative confocal images of LAMP1 (red) co-immunolocalization (merged) with EEA1 (magenta) and giantin (green). Insets are two-fold magnifications of regions in boxes. Note that LAMP1 and giantin co-localized in cells treated with nocodazole. Scale bar = 30 μm

