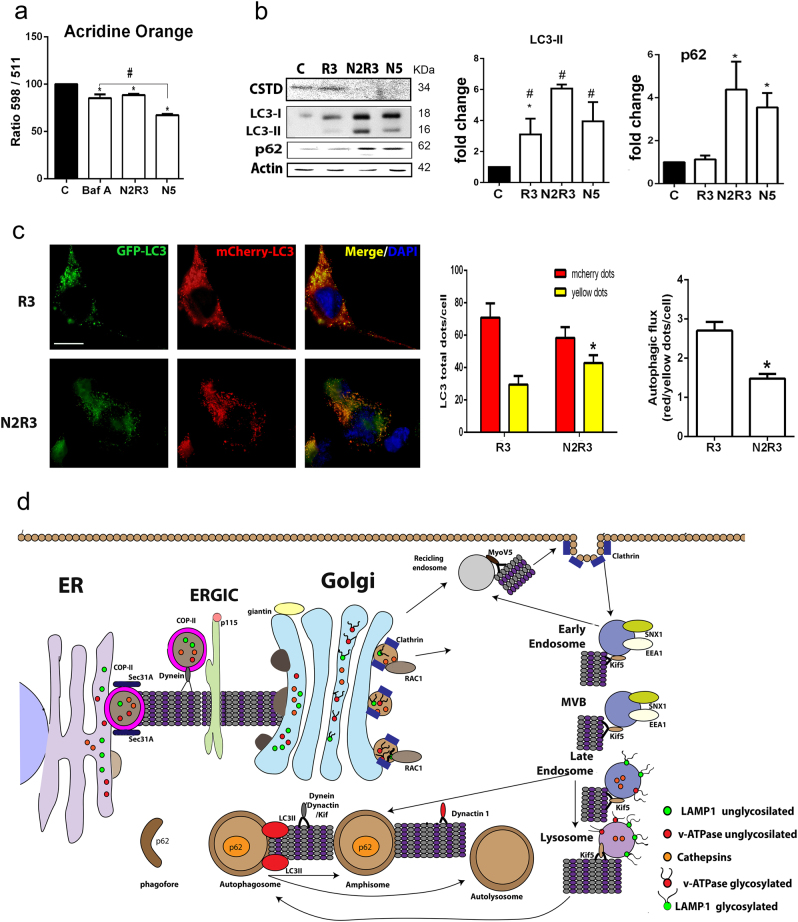
Fig. 5. Altered lysosomal function and autophagy flux blockage in the in vitro model.
a Bar graph of the means (± SEM) of the ratios of the absorbance at 598 (red) to 511 (green) within the cytoplasm of cells stained with acridine orange. Shift toward the green indicates loss of acidity. BafA was used as a positive control (*p < 0.05 vs. untreated control; #p < 0.05 vs. nocodazole, one-way ANOVA). b Western blot showing the levels of p62, cleaved CTSD, LC3I, and LC3II in control NSC34 cells and cells treated with nocodazole (N) or rapamycin (R) alone or sequentially with nocodazole and rapamycin (N2R3). Bar graphs show the average fold change of these proteins relative to control with normalization to actin. c Left, Microphotographs of NSC34 cells transfected with the mCherry-GFP-LC3 plasmid and treated as indicated. Scale bar = 30 µm. Right, Bar graphs with quantification of yellow and red puncta and the ratio (*p < 0.05, non-parametric t-test). d Schematic of the secretory, endosomal, and autophagy pathways that are affected in MNs early in the neurodegenerative process after RA

