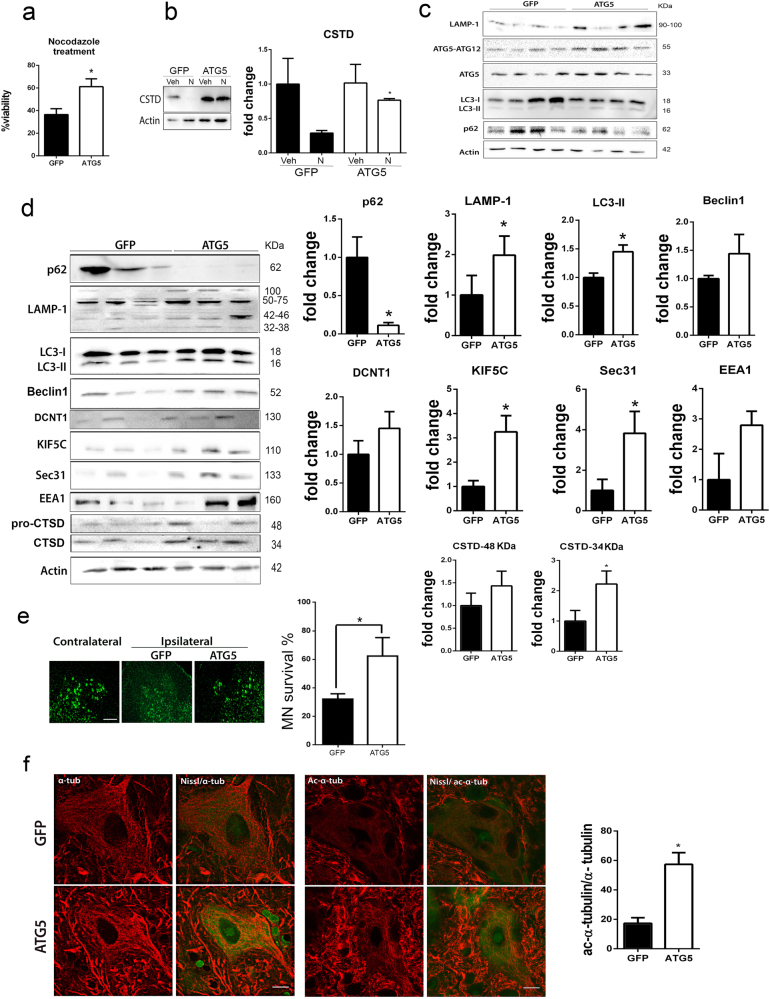
Fig. 7. ATG5 overexpression neuroprotects and modulates motor and secretory pathway-related proteins and cytoskeleton.
a Bar graphs of the mean average percentage of survival of NSC34 cells, transfected with CMV-GFP or CMV-ATG5 plasmids, at 18 h after nocodazole (N) treatment and analyzed by MTT assay (n = 4; *p < 0.001 vs. control, one-way ANOVA). b Analysis of processed CTSD by western blot in transfected cells treated with vehicle (Veh) or nocodazole. c Western blot showing the levels of different autophagy hallmarks at the ipsilateral side of the spinal cord ventral horn from non-injured animals injected with AAVrh10-GFP or AAVrh10-ATG5 at 3 weeks post injection. Note LAMP1, ATG5-ATG12, ATG5, LC3II abundance, and normal p62 levels. d Western blot and corresponding bar graphs of the quantification of different proteins related to autophagy (p62, LAMP1, LC3, Beclin1), cytoskeleton (DCTN1, KIF5c), the secretory pathway (Sec31, EEA1), and lysosome function (CTSD) in the spinal cord from RA-injured animals injected with AAVrh10-GFP or AAVrh10-ATG5. e Left, Microphotographs showing green fluorescent Nissl stained MNs at the contralateral side and the ipsilateral side of the spinal cord ventral horn from RA-injured animals injected with AAVrh10-GFP or AAVrh10-ATG5. Right, Bar graphs showing the percentage of MN survival at the ipsilateral side with respect to the contralateral side of the same sample. f Representative microphotographs of MNs stained with α-tubulin (α-tub) or acetyl-α-tubulin (Ac-α-tub) from the different groups and associated bar graphs of the ratio of the percentage of immunoreactivity for Ac-α-tub with respect to α-tub. Scale bar = 10 µm

