Fig. 4.
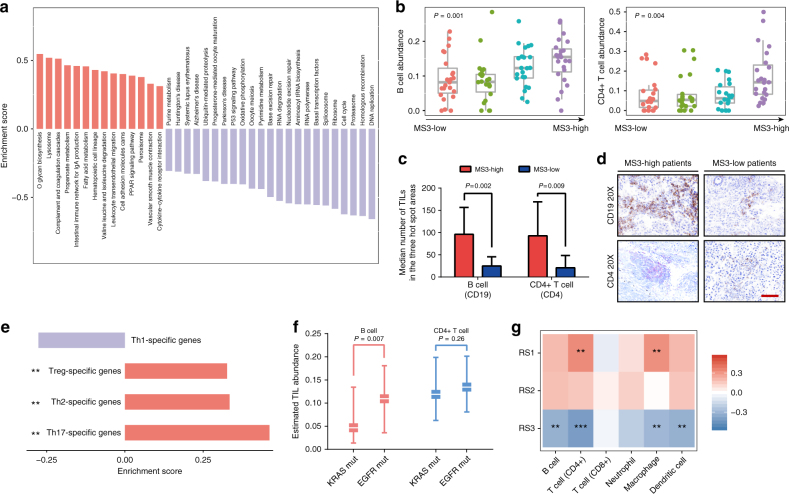
MS3 dominance was characterized by enriched tumor-infiltrating lymphocytes (TILs). a The GSEA analysis revealed that the genes positively correlated with MS3 were enriched in immunological pathways. b B cells and T cells were significantly associated with the MS3 proportion. The box plot displays the first and third quartiles (top and bottom of the boxes), the median (band inside the boxes), and the lowest and highest point within 1.5 times the interquartile range of the lower and higher quartile (whiskers). c Results of the immunohistochemistry (IHC) validation of the association (CD19 represents B cells and CD4 represents CD4+ T cells). d Representative images of IHC in MS3-high patients and MS3-low patients, scale bar, 100 μm. e The GSEA analysis revealed that genes with expression levels correlated with MS3 were significantly enriched in regulatory T cell (Treg)-, T helper cell (Th) 2- and Th17-specific gene sets. f B cells were present in significantly higher levels in TCGA patients with EGFR mutations than with KRAS mutations. The median, first and third quartiles are presented. g RS1 contribution was positively correlated with abundance of infiltrating CD4 T cells and macrophages. RS3 contribution was negatively correlated with abundance of multiple TILs. Spearman Correlation ***P < 0.001; **P < 0.01; *P < 0.05

