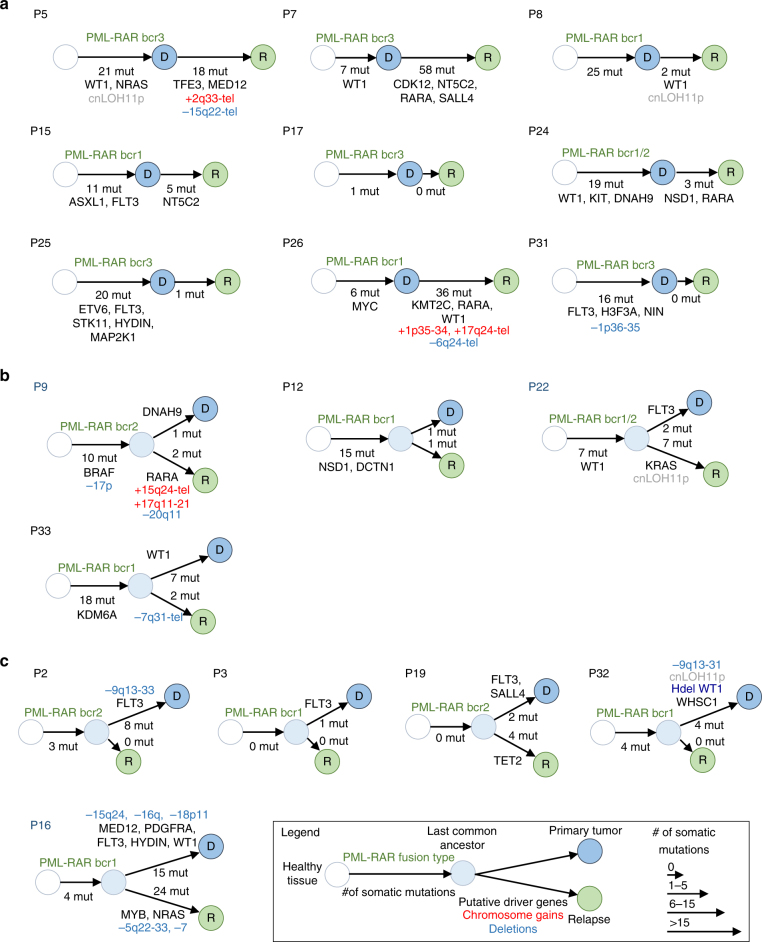
Fig. 2.
Tumor progression trees reconstructed for 18 patients with matched primary tumor and relapse samples. For each patient, a diagram represents the predicted evolution linking the cell of origin (white circle), the PML/RARA-expressing common ancestor (light blue circle), the diagnostic sample (dark blue circle), and the relapse sample (green circle). The number of somatic protein-coding mutations occurring at each step is indicated below the arrows, together with the type of PML/RARA breakpoint, chromosomal gains (red), and deletions (blue), and mutations affecting known driver genes or new recurrent genes identified in this study. The size of arrows is proportional to the number of somatic mutations occurring at diagnosis or relapses. Three major modes of evolution are identified. a Nine patients present a linear evolution where all events detected at diagnosis are also present at relapse, with (P5, P7, P8, P15, P24, P25, P26) or without (P17, P31) new acquired alterations. b Four patients display branched evolution with many alterations shared by the primary and relapse samples but also specific to one or the other, suggesting that the relapse evolved from a sub-clone of the primary tumor. c Five patients displayed no or very few alterations apart from the PML-RARA fusion in the relapse samples, suggesting that they emerged from pre-leukemic PML/RARA-expressing clones

