Fig. 3.
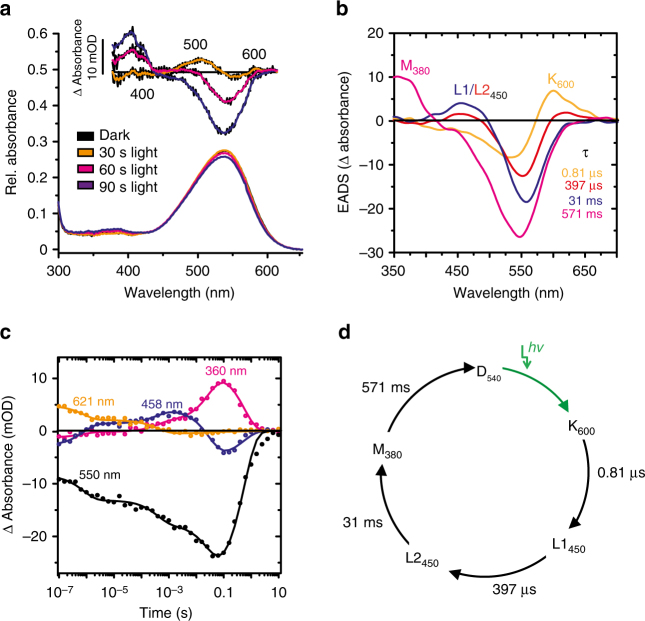
Spectroscopic analysis of purified CaRh. a UV–Vis spectrum of CaRh (aa 1–396) in detergent at pH 7.5 before (black) and after illumination (30–90 s, 530 nm, 0.54 mW mm−2). Inset: light–dark difference spectra. b CaRh photocycle intermediates, depicted by capitals and absorption maxima, were identified by absorption changes (evolutionary-associated difference spectra (EADS)) after a short laser flash (10 ns, 532 nm, 15 mW). EADS and their life times (tau) are derived from a global fit routine. c Temporal dependence of photo-intermediates determined from absorbance changes at the depicted wavelengths, which were identified in b, plotted against time. d Proposed photocycle model of CaRh, details are described in the text. (Black arrows indicate thermal conversion)

