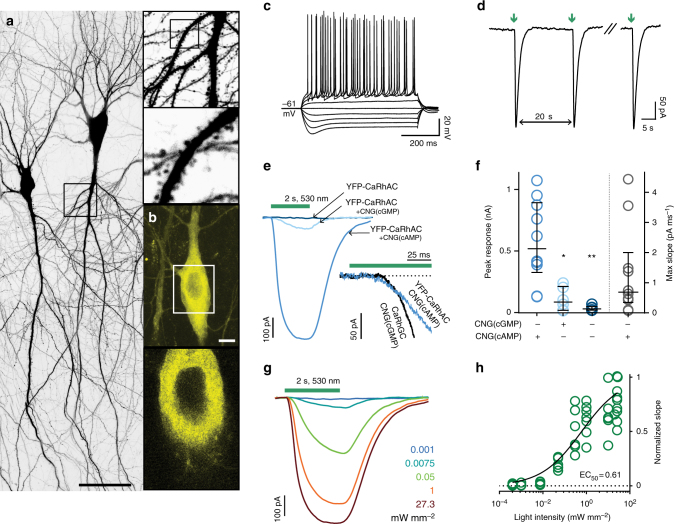
Fig. 6.
YFP-CaRhAC rapidly produces cAMP in hippocampal neurons. Two photon images of a neuron expressing YFP-CaRhAC (YFP-BeRhGC E497K C566D) and mtSapphire (a) or YFP-CaRhAC alone (b); a maximum intensity projection, excitation 800 nm, scale bar 50 µm; b top: maximum projection, excitation 950 nm; bottom: single plane YFP fluorescence 950 nm of same neuron. scale bar 10 µm. c Whole-cell response to current injections of a hippocampal neuron expressing YFP-CaRhAC plus the cAMP-sensitive CNGA2 channel (CNG(cAMP) C460W/E583M). Current injections from -400 pA to 400 pA in 100 pA steps. d The first, second and fifth currents evoked by repeated green light flashes (530 nm, 0.3 mW mm−2, 100 ms, interval 20 s). e Sample currents evoked by strong green light (27.3 mW mm−2) in neurons expressing YFP-CaRhAC together with CNG(cGMP), CNG(cAMP) or alone. Green bar: light application, 2 s. Insert shows the onset and initial slope of the YFP-CaRhAC + CNG(cAMP) photocurrents in comparison to photocurrents from a CaRhGC + CNG(cGMP) expressing neuron. f Comparison of the maximum peak or slope of photocurrents recorded from neurons expressing YFP-CaRhAC and one of the CNG channels or by itself. Shown are individual data points, median and interquartile range, n’s = 10, 6, 6, 10 left to right. *p = 0.023, **p = 0.0016, Kruskal–Wallis test vs YFP-CaRhAC + CNG(cAMP). g Sample currents recorded from a neuron expressing YFP-CaRhAC + CNG(cAMP) when stimulated with green light of different intensity. h Light intensity-response relationship for YFP-CaRhAC + CNG(cAMP) fitted with a quadratic equation. Photocurrents were normalized to the maximum current recorded for each neuron. n = 8. DNA encoding rhodopsin-adenylyl cyclases was electroporated at 25 ng µl−1, CNG channel DNA at 25 ng µl−1 and mtSapphire DNA at 5 ng µl−1

