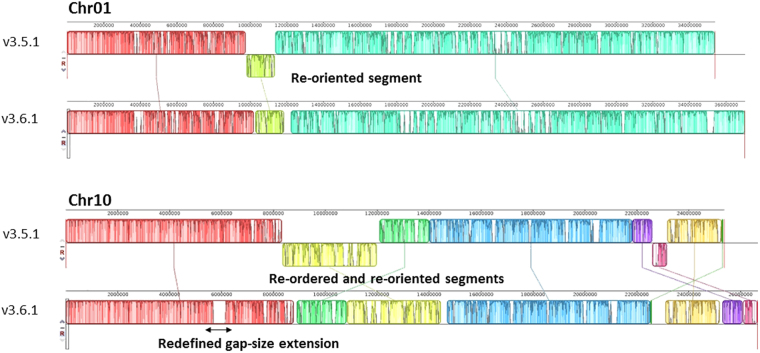
Figure 1.
Examples of OpGen correction. The chromosomes are laid out horizontally and homologous segments between v3.5.1 and v3.6.1 are shown as colored blocks. Each color block stands for a scaffold or consecutive merged scaffolds. Blocks that are shifted downwards represent re-oriented segments in v3.6.1. Blocks that are swiped/translocated in another position represent re-ordered segments. Gap size correction is shown as white gaps inside the blocks.

