Fig. 3.
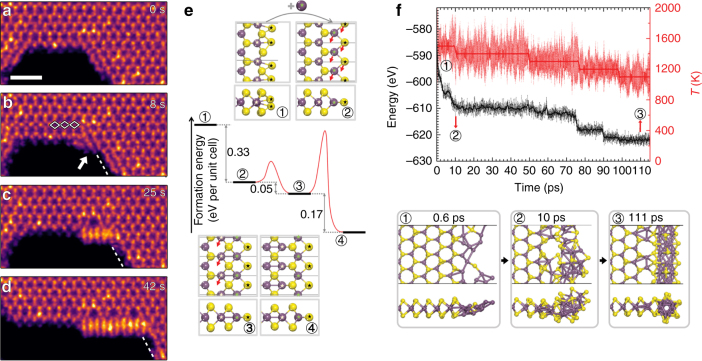
Edge reconstruction dynamics. a–d Atomic resolution HAADF-STEM image frames showing typical states in the process of edge reconstruction from a ZZSe-Se to ZZSe-Mo-NW30. Scale bar is 1 nm. e Total energy (black) and energy barrier (red) associated with the four critical steps for ZZSe-Se (a) to ZZSe-GB4-Se (b) transformation, calculated at µMo = 1.2 eV. Top and front views of the relaxed structures of the four critical steps are displayed. f (Top) AIMD simulation of the edge energy (black) and system temperature (red) plotted over time with a time interval of 1 fs in the process of NW evolution. The black and red solid bold lines, representing energy and temperature respectively, are smoothed data to guide the eye. The energy of the system keeps decreasing, indicating increased stability. (Bottom) top and front view snapshots of edge structure at noted times

