
FIGURE 4.
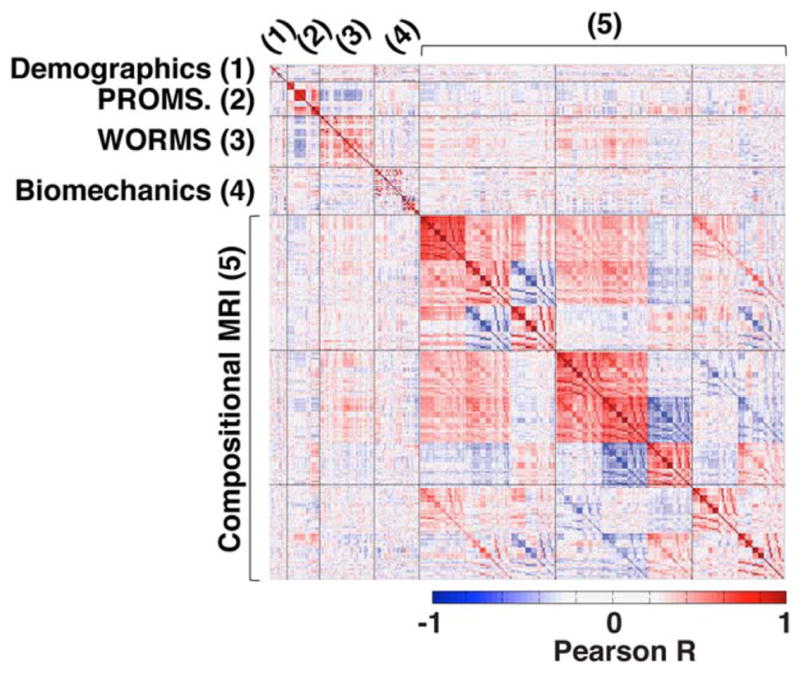
Heat map of the correlation matrix of all 366 collected endpoints. Positive correlations are shown in red and negative correlations in blue.
Official websites use .gov
A
.gov website belongs to an official
government organization in the United States.
Secure .gov websites use HTTPS
A lock (
) or https:// means you've safely
connected to the .gov website. Share sensitive
information only on official, secure websites.
Heat map of the correlation matrix of all 366 collected endpoints. Positive correlations are shown in red and negative correlations in blue.