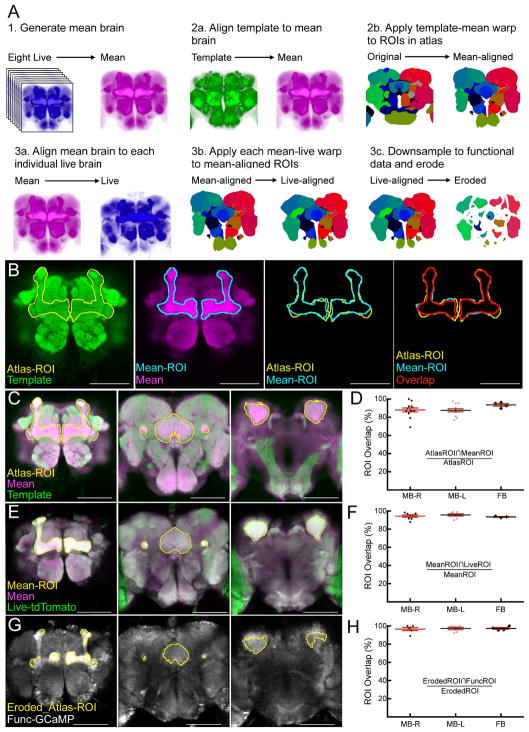
Figure 1. Alignment of brain atlas to functional brain data.
(A) Schematic of three-step brain alignment. (1) Eight anatomical scans of a myr:tdTomato channel from live animals were aligned to each other and averaged to generate the “mean” brain. (2a) Template brain was aligned to the mean brain. (2b) Fly brain atlas was warped to the mean brain according to the parameters in (2a). (3a) Mean brain was aligned to each individual live anatomical scan. (3b) Fly brain atlas was warped to each individual animal according to the parameters in (3a). (3c) Fly brain atlas was downsampled to the functional resolution scan and eroded by one voxel at the edges of each ROI. Examples shown in (A) are single slices used only for visualization purposes. (B) Example of the calculation of overlap shown in d, f, and h. From left to right: Post-alignment of template brain (green) to mean brain, showing ROIs from the fly brain atlas (Atlas-ROI, yellow) corresponding to the mushroom bodies (MB). Mean brain (magenta) with manually drawn ROIs corresponding to the MB of the same section (Mean-ROI, blue). Overlay of the fly brain atlas ROIs and manually drawn ROIs. Overlay of the fly brain atlas and manual ROIs also depicting the overlap (AtlasROI∩MeanROI) (red). (C) Example overlays of template (green) and mean brain (magenta) with Atlas-ROIs (yellow) from the MBs and the fan-shaped body (FB) anterior to posterior (left to right). (D) Quantification of overlap between atlas-ROIs and mean-ROIs expressed as a percent of in-plane area of the atlas-ROI. ROIs were drawn at 20μm intervals (MB, 26 in-plane ROIs, 13 in each hemisphere) and 15μm intervals (FB, 4 in-plane ROIs). (E) Example overlays of mean brain (magenta) and live anatomical scan (Anat-tdTomato, green) with Mean-ROIs (yellow) from the MBs and the FSB body anterior to posterior (left to right). (F) Quantification of overlap between mean-ROIs and live-ROIs expressed as a percent of in-plane area of the mean-ROI. (G) Example overlays of eroded fly brain atlas ROIs (Eroded-ROI, yellow) and functional data (Func-GCaMP). (H) Quantification of overlap between eroded-ROIs and func-ROIs. Note that no images used to create the “mean” brain were used to quantify registration quality. For panels D, F, and H, individual points represent the overlap for each in-plane ROI. Data is plotted as the mean ± SEM. Scale bars are 100μm. See also Figure S1.
Description of ROI terminology: Mean-ROI, manually drawn ROIs from the mean brain; Atlas-ROI, ROIs from the atlas; Live-ROI, manually drawn ROIs from live anatomical data; Func-ROI, manually drawn ROIs from functional GCaMP data (Func-ROI); Eroded_Atlas-ROI, ROIs from the atlas that have been resampled to functional resolution and eroded by one voxel.

