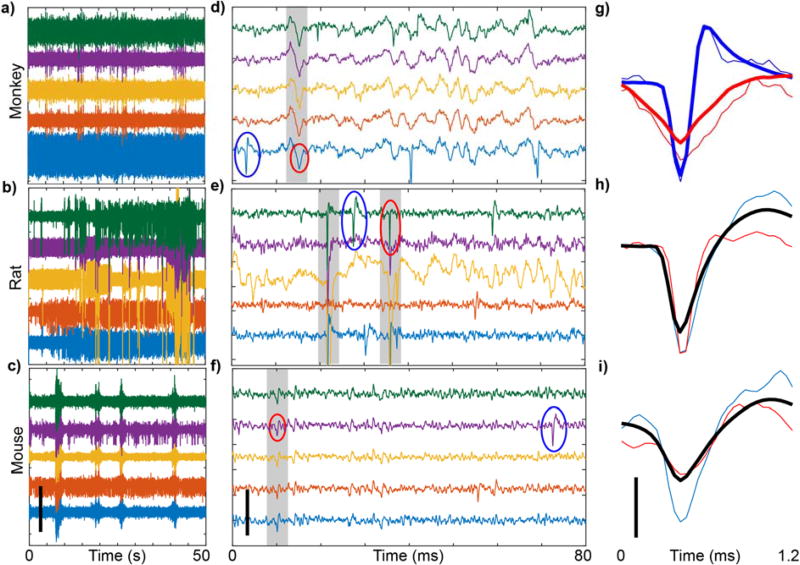
Figure 2. Animal movement creates electrophysiological artifacts that contaminate data.
a–c) Sample recordings from awake, freely moving NHP (96 channel, M1), rat (16 channel, M1), and mouse (16 channel, V1), over 50s, filtered with 2nd order, 0.3–1kHz passband Butterworth filter. Artifacts are observed as high amplitude activity that occurs across multiple channels simultaneously. d–f) Same as (a–c), except over 80ms. Gray shading highlights simultaneous spikes across channels. Action potentials and artifacts are denoted by blue and red circles, respectively. g–i) Representative waveforms detected from clustering. Thin blue and red lines are circled waveforms from (a–c). Thick lines are mean waveforms for the respective clusters. Note that in rats and mice, PCA and k-means clustering did not separate artifacts from action potentials, and therefore the mean waveform (shown in black) includes both action potentials and artifacts. Scalebars: a–f) 400µV, g–i) 100µV.

