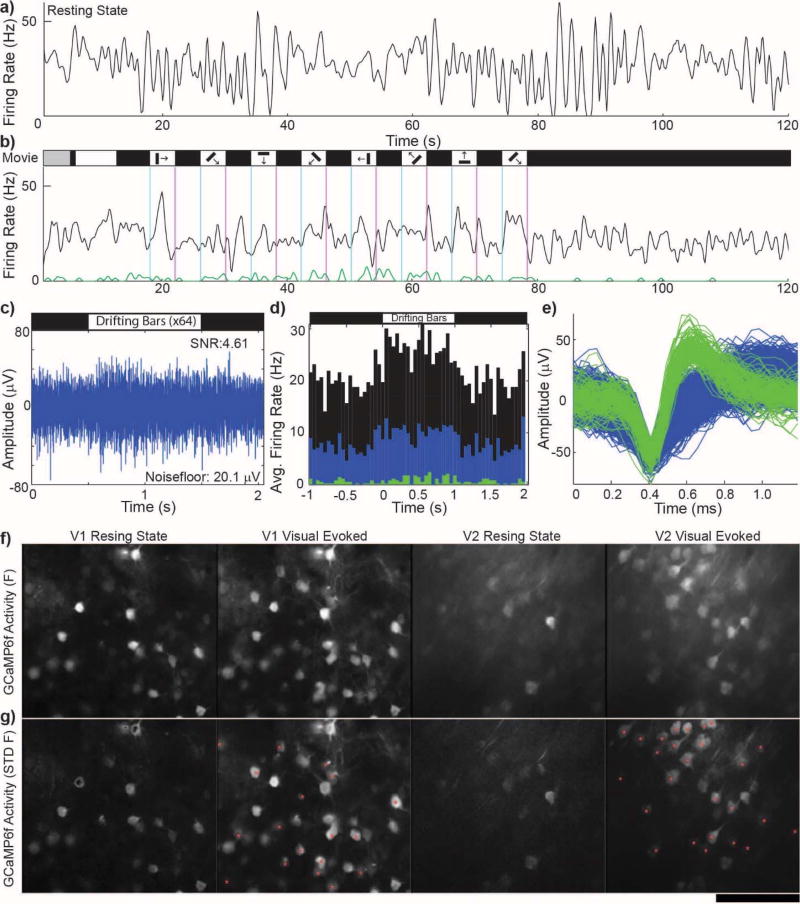
Figure 3. Healthy, quiescent neurons in isoflurane anesthetized mouse visual cortex are evoked with visual stimulus presentation.
a) Example channel showing the firing rate of only the unsorted outlier after automated spike sorting (multiunit: black). b) Same as (a) except visually evoked with a drifting grating movie. Auto-spike sorting discriminated a high amplitude, low firing SU (green) which increased firing rate during a mild visual stimulus (1 set of 8 direction stimulus for 4 s each). Note: First 15 s are movie calibration. c) Raw spike channel (300–5000 Hz) show increased spiking during the ‘ON’ phase of strong visual stimulus (8 set of 8 direction stimulus for 1 s each). d) PSTH of (c) showing increased firing during the ‘ON’ phase of the strong visual stimulus. Colors represent sorted (green, blue) and unsorted (black) threshold crossings. e) Pile plots of green and blue SU waveforms from (b) and (d) sorted using PCA and K-means clustering. a–e) Electrophysiological recording on the same recording site from the same day, 2 months post-implant. Reprinted from8, Copyright 2015, with permission from Elsevier. f) Average 20 s GCaMP6f activity in V1 and V2 layer II/III neurons during resting state (spontaneous) and visually driven via contralateral eye. g) Standard deviation of intensity changes of GCaMP6f activity during (f). Red * indicate quiescent neurons during resting state that were driven by visual stimulus.

