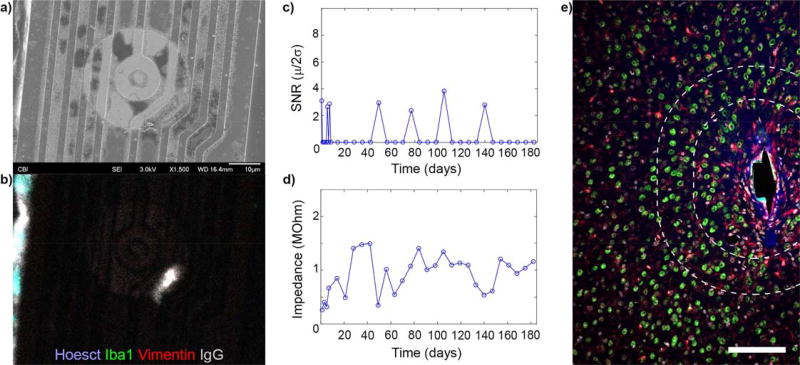
Figure 6. Loss of recording performance in mouse V1 without material degradation or loss of neural density.
a) SEM showing intact electrical traces. b) Immunohistochemistry on probe (a) showing no tissue adhesion. c) No SU were detected on (a) 6 weeks prior to animal sacrifice. d) Impedance of (a) remain in good range and does not dip below pre-implantation levels. e) Immunohistochemistry of tissue section corresponding to (a-d) (NeuN = green, Iba1 = red, Hoechst = white, IgG = blue). Recording site faces left on the shank. Some IgG is present around the implant, but there is limited microglial scarring and high density of neurons (50 neurons with 100 µm of the recording site and 150 neurons within 160 µm). (e) reprinted from7, Copyright 2014, with permission from Elsevier. Scalebar = 100 µm

