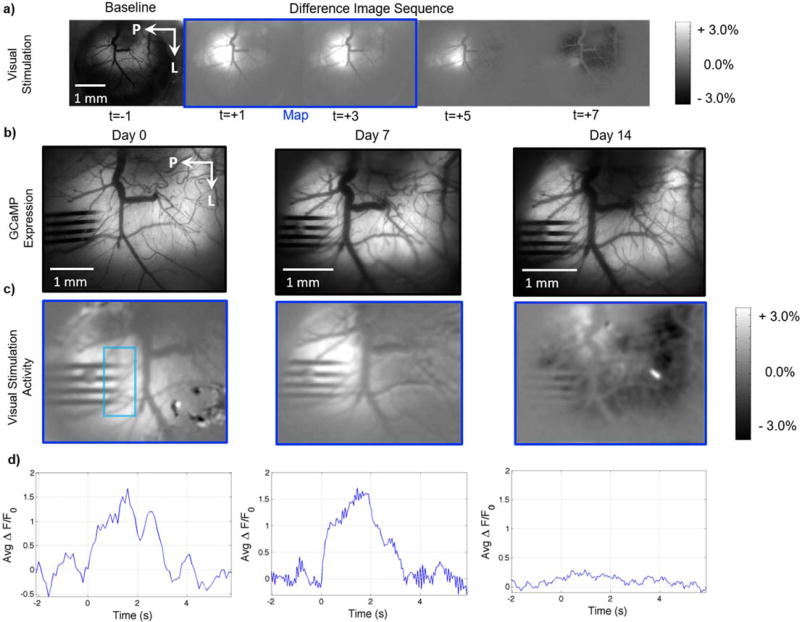
Figure 7. Decreased neural activity evoked by visual stimulation around the implant of lightly anesthetized AAV-Syn-GCaMP6f mice.
a) Representative difference image sequence showing GCaMP increases in visual cortex during visual stimulation, prior to 4 shank silicon electrode implantation. The image sequence was generated by subtracting a pre-stimulation baseline image (e.g. left-most image in the row) from subsequent images (t>0s). The blinking LED visual stimulus was presented while the images outlined in the blue rectangle were acquired. b) Images of GCaMP expression on the day of implantation and the following two weeks, showing no noticeable changes in GCaMP expression around the implanted electrode. c) Visual activity maps obtained as shown in (a). Bright areas show increases in GCaMP signal evoked by visual stimulation around the implanted area on the day of implantation. The increases in activity diminish over the bottom two shanks on Day 7, and the cortex around the implanted area appears unresponsive 14 days post-implantation. No obvious superficial injury or bleeding was observed post-implantation. d) Average ROI GCaMP timeseries at each time point, showing a marked decrease in visually evoked activity, as measured by GCaMP fluorescence, at day 14. Visual stimulation from 0 to 2 seconds. ROI denoted by teal rectangle in (c)

