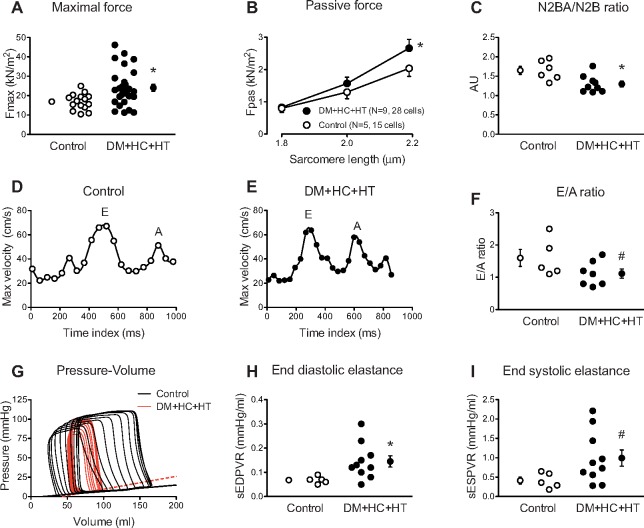
Figure 6.
Increased maximal (Fmax, A) and passive force (Fpas, B) were seen in DM + HC + HT as compared to Controls. Cardiomyocyte data were averaged for all measured cells and group averages are shown. Titin N2BA/N2B isoforms ratio was significantly decreased in DM + HC + HT animals (C). Typical examples of E and A waves in Control (D) and DM + HC + HT (E) animals and pressure–volume relationships (G) are presented. The early to late filling (E/A) ratio tended to be lower in the DM + HC + HT animals (F). End-diastolic elastance (slope of EDPVR, sEDPVR) was significantly increased (H) while a trend towards significance in the end-systolic elastance (slope of ESPVR, sESPVR) was recorded (I), *P < 0.05, #P = 0.10 DM + HC + HT vs. Control.

