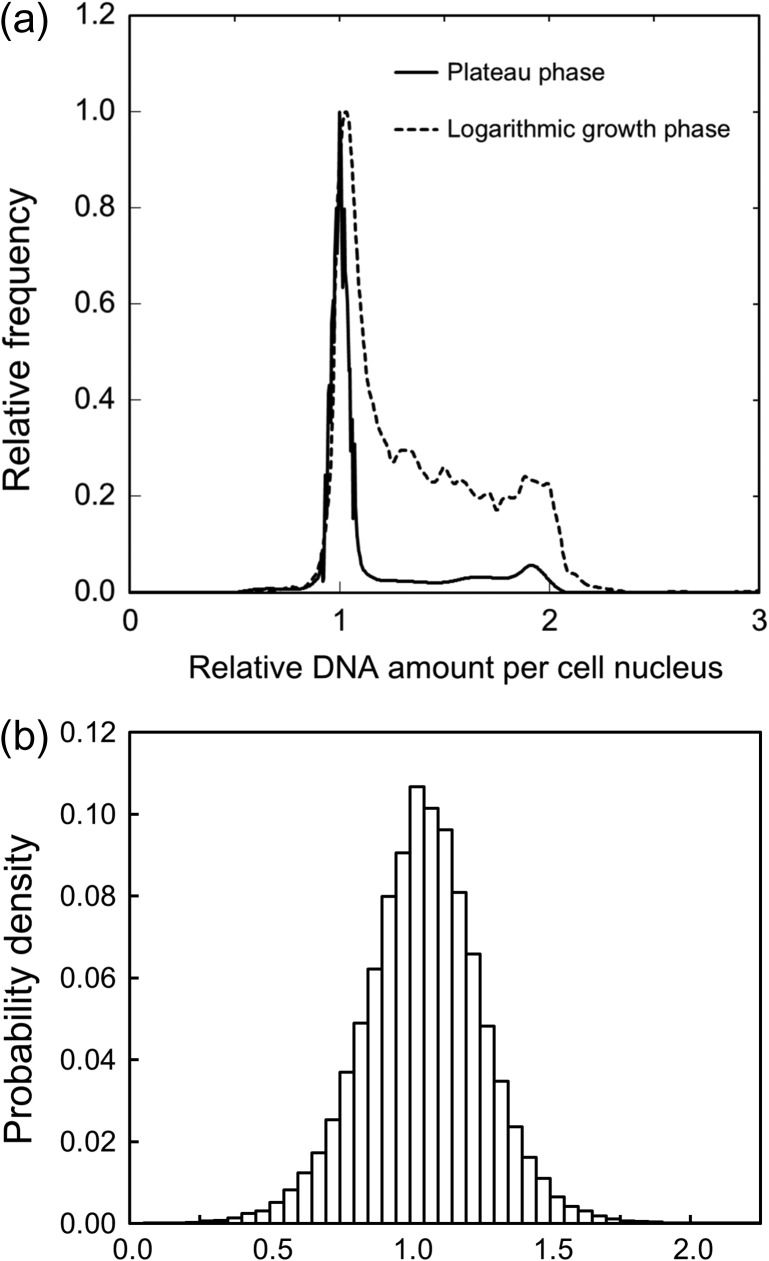
Fig. 5.
Results of the flow cytometric analysis for obtaining DNA amount, and the Monte Carlo simulation for calculating energy deposition per cell nucleus: (a) for DNA profiles in two different cell conditions, (b) for the distribution of energy imparted to the cell nucleus. In Fig. 5a, the solid line is for the plateau phase condition mostly consisting of G0/G1 cells (G0/G1: S: G2/M = 78.9%: 12.6%: 8.48%), and the dotted line is for the logarithmic phase condition as another profile (G0/G1: S: G2/M = 32.4%: 56.9%: 10.7%). The intensity was normalized by that with the cells in a hybrid mix of the G0/G1 phase.

