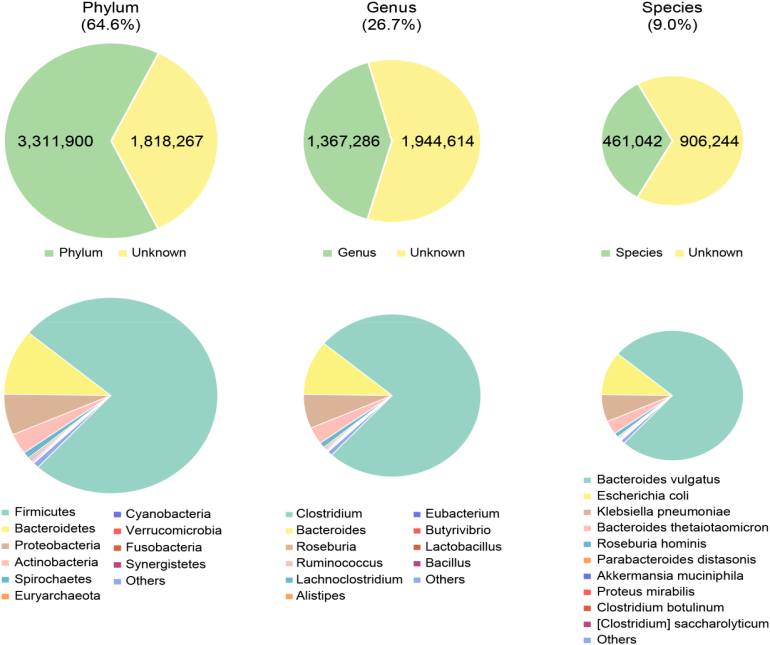
Figure 4:
Annotation of the non-redundant genes to phyla, genera, and species. The numbers of non-redundant genes that could be annotated to a phyla, genera, and species are shown with the numbers are shown. The green area reflects the proportion of genes that could be annotated to a phylum, genus, and species. The yellow area reflects unannotated genes. The identity of phyla, genera, and species harboring the annotated genes is displayed below the pie charts.

