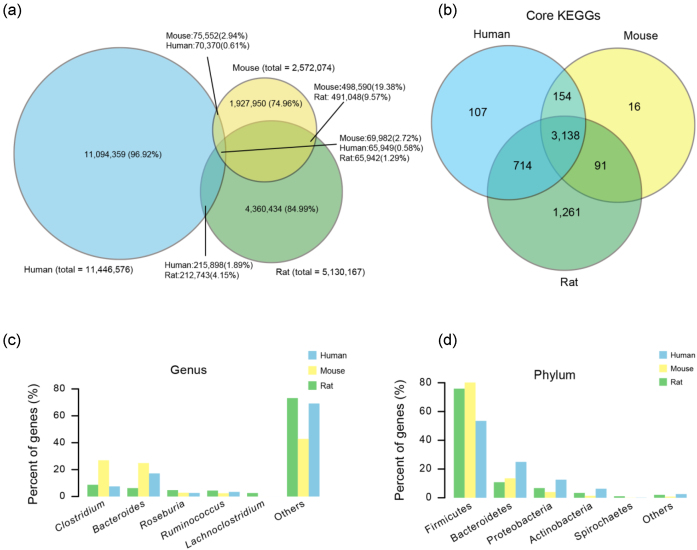
Figure 6:
Comparison of the gut microbiome gene catalogs of human, mouse, and rat. a) Venn diagram of non-redundant genes shared between human (blue), mouse (yellow), and rat (green) gut microbiome catalogs. b) Venn diagram of KO functions shared by the human, mouse, and rat microbiota. c) Percentage of genes in genera including Clostridium, Bacteroides, Roseburia, Ruminococcus, andLachnoclostridium in the gut microbial gene catalogs of rat, human, and mouse.d) The percentages of genes assigned to Fimicutes, Bacteroidetes, Proteobacteria, Aclinobacteria, and Spirochaetes in the gut microbiomes of rat, human, and mouse, respectively.

