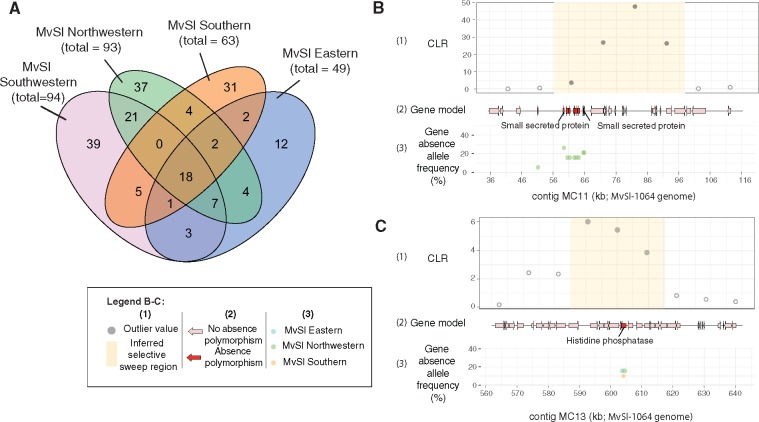
Fig. 5.
—Gene presence–absence polymorphism within individual genetic clusters in Microbotryum lychnidis-dioicae (MvSl) and localization within previously identified selective sweep regions. (A) Venn diagram for shared and unique gene presence–absence polymorphism events in the four MvSl genetic clusters. Genetic clusters were defined on the basis of dendrograms (fig. 4D). (B) Localization of a gene presence–absence polymorphism within a selective sweep previously identified by (Badouin et al. 2017) in the Northwestern genetic cluster for MvSl. The region with coordinates 36–116 kb on the MvSl-1064 MC11 contig is represented, corresponding to the MvSlA1A2r3c_S01: 2964344-3005424 selective sweep region described by (Badouin et al. 2017); (C) Localization of a gene presence–absence polymorphism within a selective sweep previously identified by (Badouin et al. 2017) in the Northwestern genetic cluster for MvSl. The region with coordinates 560–640 kb on the MvSl-1064 MC13 contig is represented, corresponding to the MvSlA1A2r3c_S11: 445169-475073 selective sweep region described by (Badouin et al. 2017). For (B) and (C), the following are shown in each panel, from top to bottom: (1) The composite likelihood ratio (CLR) from a SweeD analysis with outlier values in light blue and the inferred selective sweep region in yellow. All data were retrieved from (Badouin et al. 2017); (2) Gene models for the MvSl-1064 strain, for genes displaying presence–absence polymorphism in the Northwestern cluster, shown in red; (3) Frequency of gene absence in the Northwestern genetic cluster (green), Eastern genetic cluster (blue), and Southern genetic cluster (orange) for MvS1.

