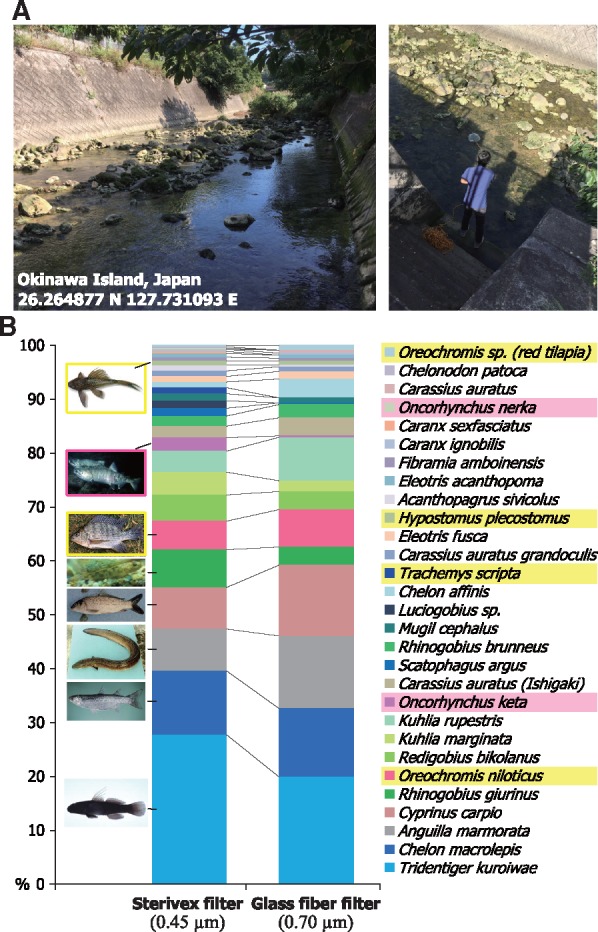
Fig. 2.

Application of MiFish pipeline to a fish eDNA data set. (A) Photos of the sampling site in Okinawa Island, Japan. (B) A summary of the species assignment results produced by MiFish pipeline. The left and right bars indicate the data of eDNA extracted using the Sterivex and glass-fiber filters, respectively. Read numbers are expressed as percentages to the total read numbers. Nonnative species in Okinawa Island are highlighted (Yellow: Invasive species, Pink: Salmons). Fish pictures are from FishBase.
