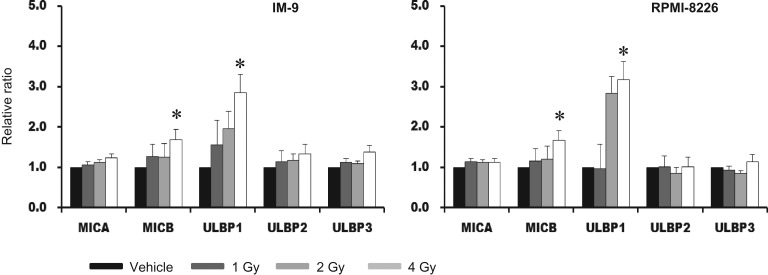
Fig. 2.
The expression of NKG2D ligands after ionizing radiation (IR) at the surface protein level. After IR treatment with doses of 1, 2 and 4 Gy, and a 24 h recovery phase, using IM-9 and RPMI-8226 cells, we obtained the mean fluorescence intensities (MFIs) using flow cytometry. Average relative folds of MFI were calculated in comparison with those of untreated cells. The surface expression of NKG2D ligands, including MICA, MICB and ULBP 1–3, were evaluated. All experiments were repeated three times, and P values of <0.05 are indicated by an asterisk.

