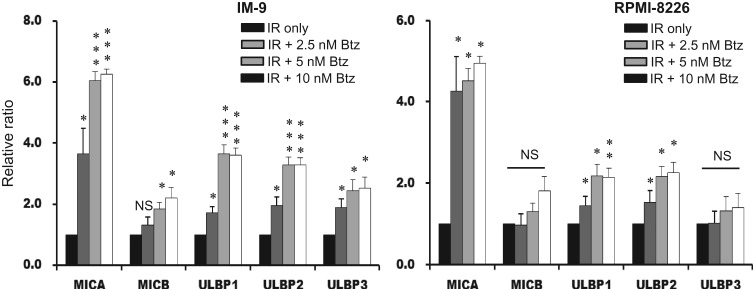
Fig. 4.
The significant induction of NKG2D ligands after combined treatment with bortezomib and ionizing radiation (IR). The expression of NKG2D ligands was evaluated using flow cytometry in IM-9 and RPMI-8226 myeloma cells. The bars represent the MFI ratios of NKG2D ligands for the various groups: IR plus 2.5, 5 and 10 nM bortezomib, and IR only. P values are indicated by a single asterisk (<0.05), double asterisks (<0.01) or triple asterisks (<0.001).

