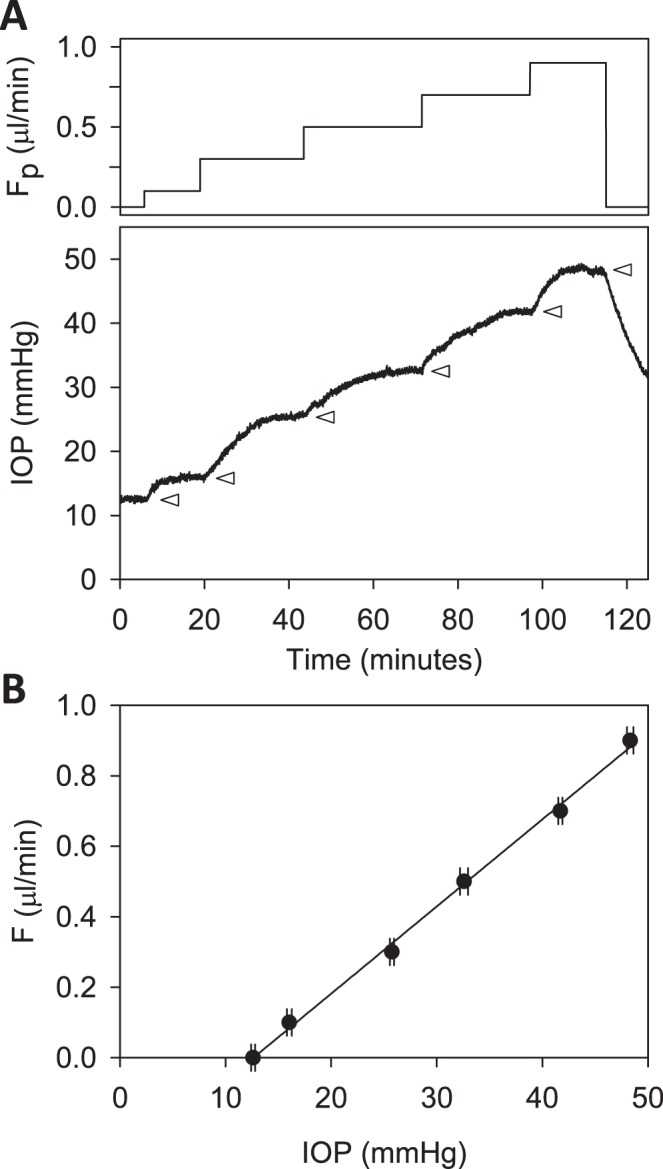
Figure 3.

Constant-flow perfusion of a live rat eye. (A) Perfusion rate (top) and IOP response (bottom) are shown for rate increments of 0, 0.1, 0.3, 0.5, 0.7, and 0.9 μL/min. Arrowheads mark the plateau level at which IOP settled after each increment. (B) Plateau IOP versus net eye flow F, which is equivalent to Fpump in a CF experiment. The slope of the regression line fit is outflow facility (C = 0.025 [0.023, 0.027] μL/min/mm Hg), and the y-intercept represents IOP-independent flow (−0.312 [−0.351, −0.273] μL/min).
