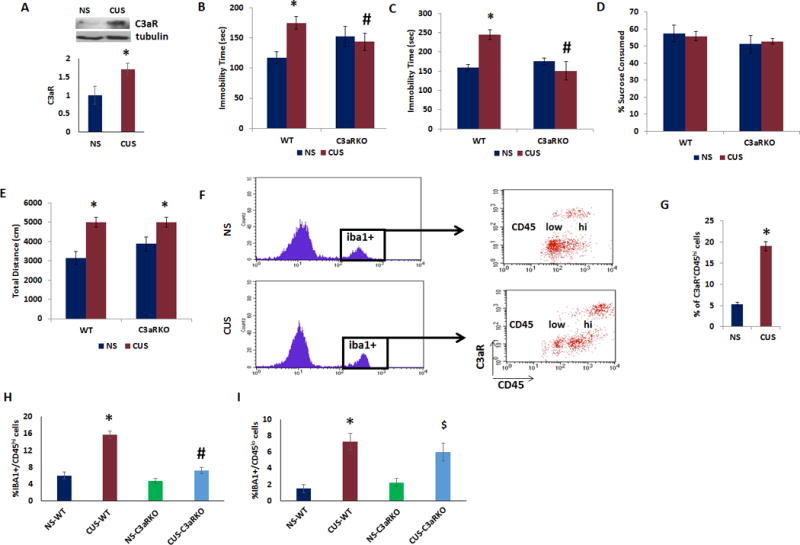
Figure 4. C3aR deficiency attenuates CUS-induced depressive-like behavior and increase in infiltration of monocytes in PFC.

(a) Top. Representative immunoblot data showing C3aR and β-tubulin expression in the PFC of male mice exposed to CUS (n=3) or no stress (NS) (n=3). Bottom. C3aR protein levels normalized to β-tubulin. Adult male C3aR knockout and wildtype (WT) mice were exposed to CUS or no stress (NS) and depressive-like behavior was determined. (b) Tail suspension test, (c) forced swim test, and (d) preference for sucrose in sucrose preference test and (e) open field test. Data are expressed as mean ± s.e.m. *P < 0.05 vs NS-WT; #P < 0.05 vs CUS-WT; two-way ANOVA. N=8 per group. (f) Adult male mice were exposed to CUS or no stress (NS) and PFC tissues were collected for flow cytometry analysis. Iba1+/C3aR+ cells were analyzed using CD45 to differentiate infiltrating monocytes (CD45hi) from resident microglia (CD45lo). (g) % of Iba1+ cells expressing C3aR and CD45hi in PFC of mice exposed to CUS or no stress (NS). Data are expressed as mean ± s.e.m. *P < 0.05 vs NS. N=4 per group. (h–i) Adult male C3aR knockout and wildtype (WT) mice were exposed to CUS or no stress and PFC tissues were collected for flow cytometry analysis. Iba1+ cells were analyzed using CD45 to differentiate (h) infiltrating monocytes (CD45hi) from (i) resident microglia (CD45lo). *P < 0.05 vs NS-WT; #P < 0.05 vs CUS-WT; $P < 0.05 vs NS-C3aRKO; two-way ANOVA. N=4 per group.
