Figure 2.
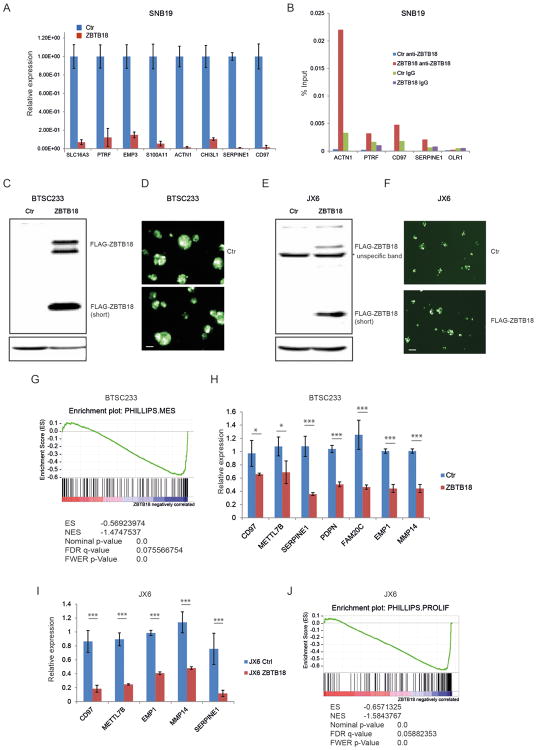
Ectopic expression of ZBTB18 in GBM cells induces repression of poor prognosis signature genes. (A) Representative qRT-PCR analysis showing gene expression changes of ZBTB18 mesenchymal targets previously predicted by ARACNE in SNB19 cells expressing ectopic ZBTB18 (n=3 PCR replicates; error bars ± s.d). Gene expression was normalized to 18sRNA. (B) Representative chromatin immunoprecipitation experiment in SNB19 cells expressing ectopic ZBTB18. The panel shows ZBTB18 binding to the promoter of a subset of mesenchymal targets (n=3 PCR replicates) expressed as percentage of the initial DNA amount in the immune-precipitated fraction. The OLR1 gene which does not contain putative ZBTB18 binding sites was used as negative control. (C) Western blot showing ectopic expression of ZBTB18 in BTSC233. The low band represents a shorter ZBTB18 isoform. (D) Representative images of GFP positive BTSC233 cells expressing control vector or FLAG-ZBTB18 construct after lentiviral infection. The scale bar represents 100 μm. (E) Western blot showing ectopic expression of ZBTB18 in JX6. The shorter ZBTB18 isoform is indicated. (F) Representative images of GFP positive JX6 cells transduced with control vector or FLAG-ZBTB18 lentiviral vector. The scale bar represents 100 μm. (G) GSEA enrichment plot for mesenchymal genes in the comparison of 233 cells expressing control vector vs. FLAG-ZBTB18. (H-I) Validation by qPCR of selected mesenchymal genes in BTSC233 (H) or JX6 (I) expressing either control vector or FLAG-ZBTB18 construct (n=3; error bars ± s.d). *p < 0.05, **p < 0.01, ***p < 0.001. Gene expression was normalized to 18sRNA. J, GSEA enrichment plot for proliferative genes in the comparison of JX6 cells expressing control vector vs. FLAG-ZBTB18.

