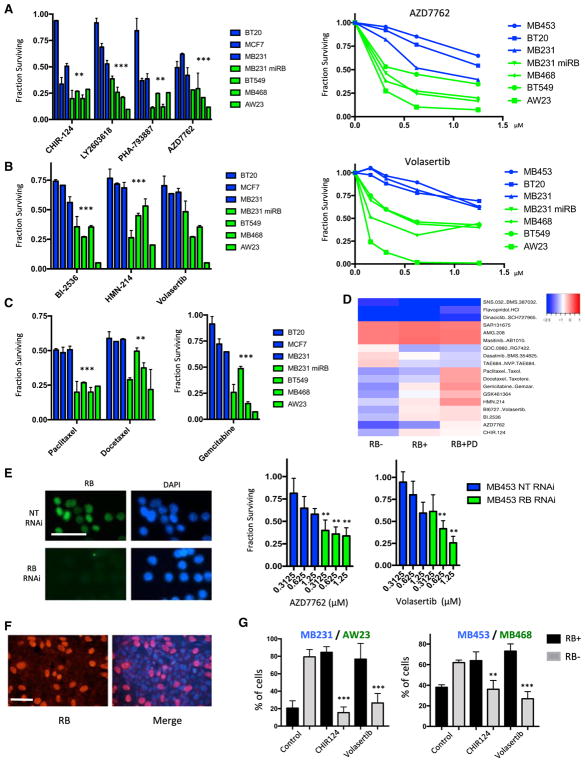
Figure 3. RB Loss Is Associated with Increased Sensitivity to PLK1 and CHK Inhibitors.
(A) Relative sensitivity of the indicated RB-proficient (blue) and deficient (green) cell lines is shown for the indicated CHK inhibitors at 1 μM. The mean and SD are shown. Dose-response analysis is shown for the indicated RB-proficient and deficient cell lines to AZD7762. Statistical analysis of the aggregated data for RB-proficient and deficient models was determined by t test (**p < 0.01, ***p < 0.001). Rhe analysis of dose responses was determined by ANOVA analysis (p < 0.001) for the comparison across RB statuses.
(B) Relative sensitivity of RB-proficient (blue) and deficient (green) cell lines is shown for the indicated PLK1 inhibitors at 1 μM. The mean and SD are shown. Dose-response analysis is shown for the indicated RB-proficient and deficient cell lines to volasertib. Statistical analysis of the aggregated data for RB-proficient and deficient models was determined by t test (**p < 0.01, ***p < 0.001). The analysis of dose responses was determined by ANOVA analysis (p < 0.001) for the comparison across RB status.
(C) Relative sensitivity of RB-proficient (blue) and deficient (green) cell lines is shown for the indicated chemotherapies at 1 μM. The mean and SD are shown. Statistical analysis of the aggregated data for RB-proficient and deficient models was determined by t test (**p < 0.01, ***p < 0.001).
(D) Heatmap illustrating different drug responses in RB-proficient, RB-deficient, and palbociclib-treated cell lines. The color bar denotes the log fold change in cell viability, with blue indicating sensitivity.
(E) MB453 cells were transfected with either control non-targeting (NT) or RB1-directed RNAi. The efficacy of the knockdown was confirmed by immunofluorescence staining for RB protein (scale bar, 50 μm). Cells were treated with the indicated dose of AZD7762 or volasertib, and cell viability was determined. The mean and SD are shown. RB deficiency was associated with increased sensitivity (**p < 0.01, ***p < 0.001, as determined by t test).
(F) Representative immunofluorescence staining of mixed cultures of RB-proficient (MB231) and RB-deficient cell lines (AW23) (scale bar, 50 μm).
(G) Two independent mixed cultures were developed (MB231/AW23 and MB453/MB468). The relative fraction of RB-positive and RB-negative cells was determined for more than 250 cells in random fields from three independent experiments. Data for untreated cultures versus those treated with CHIR124 (500 nM) or volasertib (500 nM) are shown. The statistical difference in the percentage of RB-deficient cells was determined by t test (**p < 0.01, ***p < 0.001).

