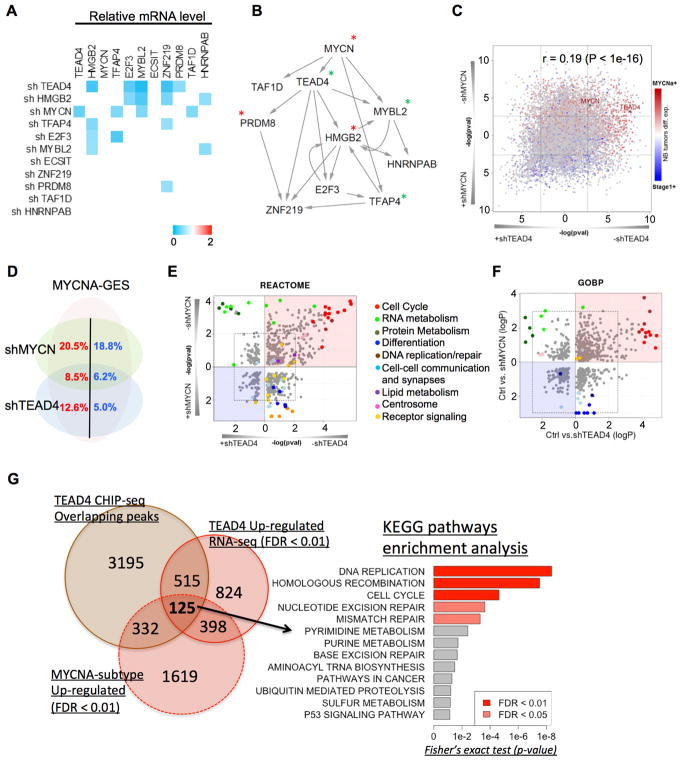
Figure 3.
TEAD4 is the master regulator of MYCNA subtype. (A) Heatmap representing gene expression changes of MYCNA subtype specific MRs from Figure 2G, upon transduction of BE2 cells with control or respective shRNAs against each MR, measured by qRT-PCR, 48hrs post-transduction. The genes showing >1.5 fold downregulation of transcript upon treatment with the shMR was considered to be a target and are displayed in the map. Samples were run in triplicate and representative experiments are shown. (B) The inter-regulatory network derived from the results in (A). *MYCN binds to the promoter of the genes by ChIP assay (Figure S5F); *TEAD4 binds to proximal region of these genes by ChIP-seq experiment (Supplementary Table S6) (C) TEAD4 (x-axis) and MYCN (y-axis) knockdowns signatures compared with MYCNA versus stage1 signature (red-blue heat colors). (D) Venn-diagram showing proportion of MYCNA subtype signature up-regulated (red) and down-regulated (blue) genes by MYCN, TEAD4 or both knockdown signatures. (E) REACTOME and (F) Gene Ontology pathway enrichment analysis performed on TEAD4 (x-axis) and MYCN (y-axis) knockdown signatures. Red circle represent positive TEAD4 targets genes (down-regulated upon knockdown) while blue circle represents negative targets (up-regulated after knockdown). Fisher’s exact test was used to calculate the statistical significance of both overlaps using a background list of 18,179 genes included in the RNA-seq signature. (G) Overlap between differentially expressed genes after TEAD4 knockdown, peak targeted genes from TEAD4-Ab ChIP-seq, and MYCNA subtype signature up-regulated genes, with the corresponding KEGG pathway enrichment analysis on the overlapping genes. See also Supplementary Figure S6 and Supplementary Tables S6 and S7.

