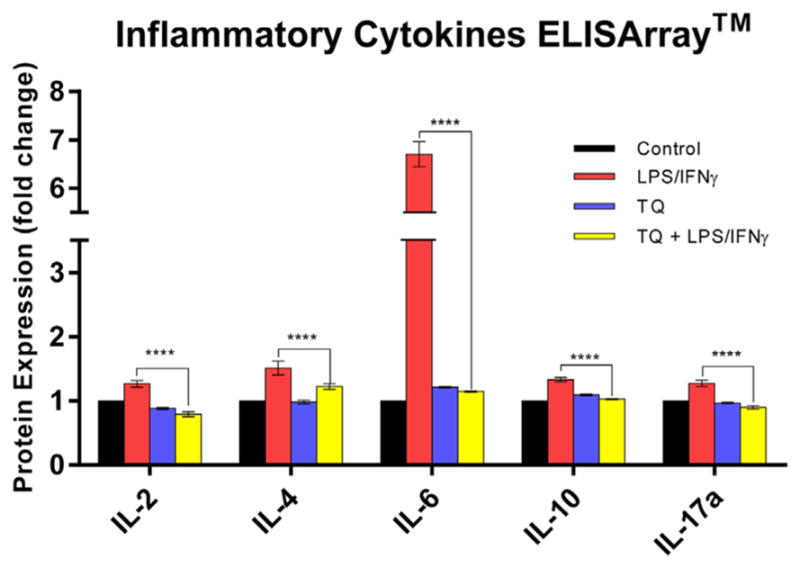
Fig. 1.

Multi-Analyte ELISArray™ for Inflammatory Cytokines & Chemokines protein expression fold change amongst the control, LPS/INFγ, TQ, and TQ + LPS/IFNγ groups. Data represent protein expression as the mean ± S.E.M (n = 3). Statistical significance of LPS/INFγ vs. TQ + LPS/IFNγ was evaluated by one-way ANOVA followed by Tukey's post hoc multiple comparisons test, p**** ≤0.0001.
