
Figure 1.
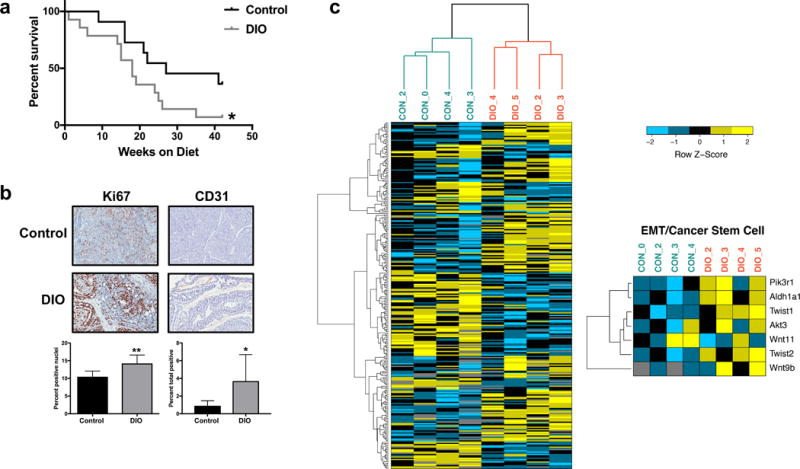
DIO decreases survival in MMTV-Wnt-1 mice. (a) Kaplan-Meier survival curves for DIO and control mice. (b) Immunohistochemical staining for tumor Ki67 and CD31 expression in DIO and control mice. Representative images shown at x20 magnification. (c) Tumor expression of CSC/EMT-related genes is modulated by DIO in MMTV-Wnt-1 mice. Heatmap illustration of differentially expressed genes in the tumors of DIO and control mice. Genes with an adjusted two-tailed P-value of <0.05 and greater than 20.75-fold change (~1.7 fold) in expression were considered differentially expressed. Differential expression of CSC/EMT-related genes is shown in the smaller heatmap on the right. *P<0.05, **P<0.01