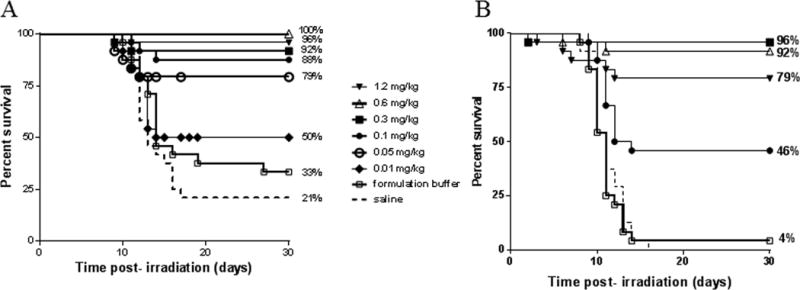
Fig 2.

Optimization of BBT-059 dose to improve survival of lethally irradiated mice. A) Effect of increasing BBT-059 dose administered SC 24 h prior to 9.75 Gy TBI (n=24/group). B) Effect of increasing BBT-059 dose administered SC 24 h prior to 10.5 Gy TBI (n=24/group). Survival curves shown here are saline (dashed line), formulation buffer (□), and BBT-059 doses 0.01 mg kg−1 (◆), 0.05 mg kg−1 (○), 0.1 mg kg−1 (●), 0.3 mg kg−1 (■), 0.6 mg kg−1 (Δ) and 1.2 mg kg−1 (▼). Percent survival on day 30 post-TBI is shown at the end of each curve.
