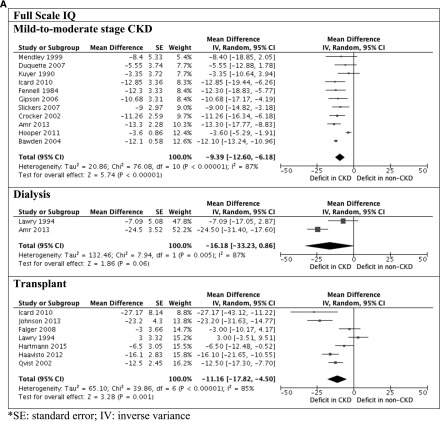
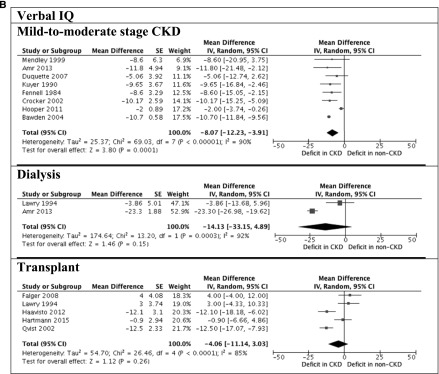
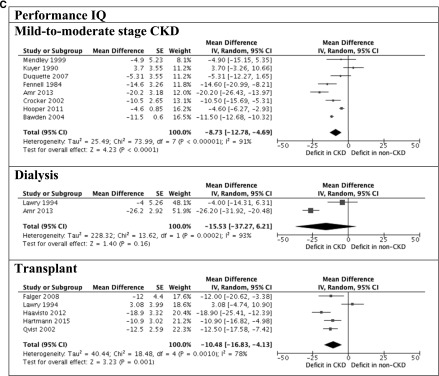
Figure 2.
Significant deficits observed in children with CKD. A shows full-scale intelligence quotient (IQ) between children with and without CKD. B shows verbal and performance IQ between children with and without CKD. 95% CI, 95% confidence interval; df, degree of freedom; IV, inverse variance; SE, SEM.


