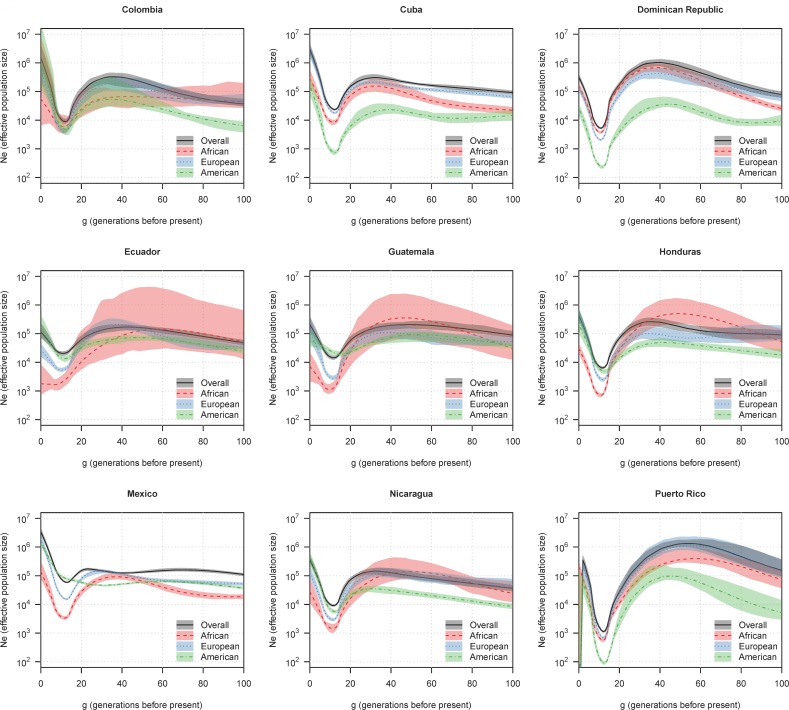
Fig 2. Estimated ancestry-specific effective population size in HCHS/SOL data.
The y-axes show ancestry-specific effective population size (Ne), plotted on a log scale. The x-axes show generations before the present. The lines show estimated ancestry-specific effective population sizes, and the colored regions show 95% bootstrap confidence intervals.

