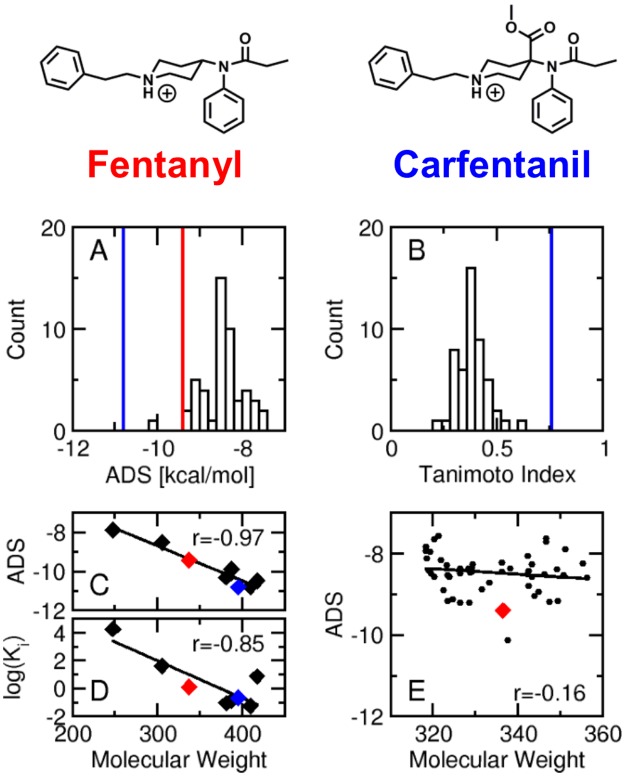
Fig 6. Decoy analysis.
(A) Distribution of the decoy binding scores. The vertical red and blue lines indicate the docking score of fentanyl and carfentanil, respectively. (B) Distribution of the Tanimoto index of the fentanyl decoys with respect to fentanyl. The vertical blue line indicates the Tanimoto index of carfentanil (Tc = 0.76) with respect to fentanyl. (C) Correlation of the fentanyl derivative molecular weight with respect to the ADS. (D) Correlation of the fentanyl derivative molecular weight with respect to the experimentally determined binding affinity (Ki). (E) Correlation of the fentanyl decoy molecular weight with respect to the ADS. In panels C-E, the red and blue diamonds indicate fentanyl and carfentanil, respectively.

