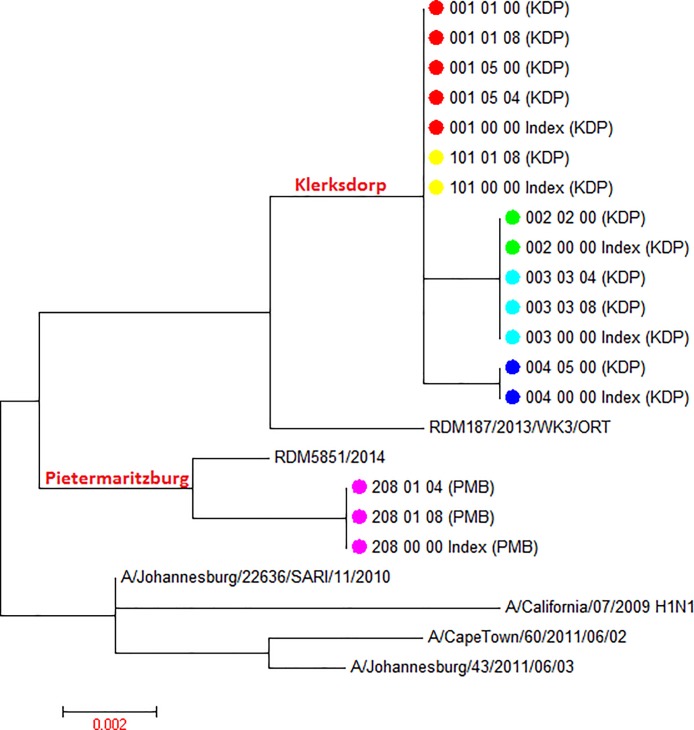
Fig 2. Maximum likelihood tree displaying phylogeny for influenza A(H1N1pdm09) HA1 sequences derived from household transmission study index cases and household contacts.
Sequences from 4 lineages are derived from 6 households. Study sequences aligned with 5 geographic control influenza HA sequences derived from South Africa between 2010 and 2014 as well as a historical A(H1N1)pdm09 reference, A/California/07/2009. Corresponding household samples are marked with the same -colour symbols at terminal nodes; geographic separation of branches is indicated on tree highlighted in red font. Study sample sequence nomenclature: Household ID_Study participant ID_Time point post-enrollment_Sample ID_(location ID). Pietermaritzburg (PMB); Klerksdorp (KDP). The scale bar represents genetic distance between sequences (nucleotide substitutions per site).

