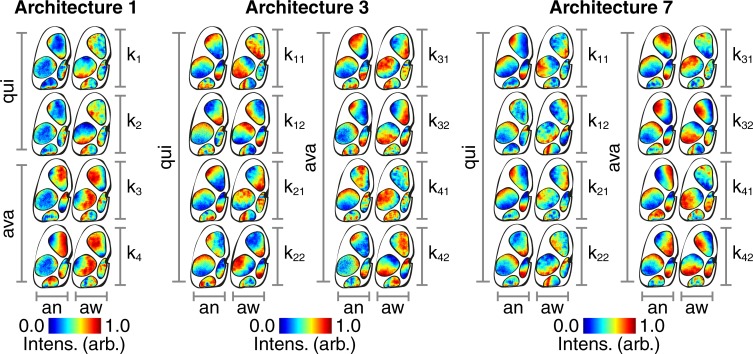
Fig 4. Hidden layer maps.
(Architecture 1) Following clustering of hidden layer activations, the centroid locations are back-projected and mapped onto the mouse cortex. The clustering algorithm partitions the data into two types of quiescence (‘qui’, ‘k1’ and ‘k2’) and two types of avalanches (‘ava, ‘k3’ and ‘k4’) for the anesthetized (‘an’) and awake (‘aw’) states. Intensity values are normalized between zero and unity within each cortical region as indicated by the color bars. (Architecture 3) Same layout as for Architecture 1. (Architecture 7) Same layout as for Architecture 1.

