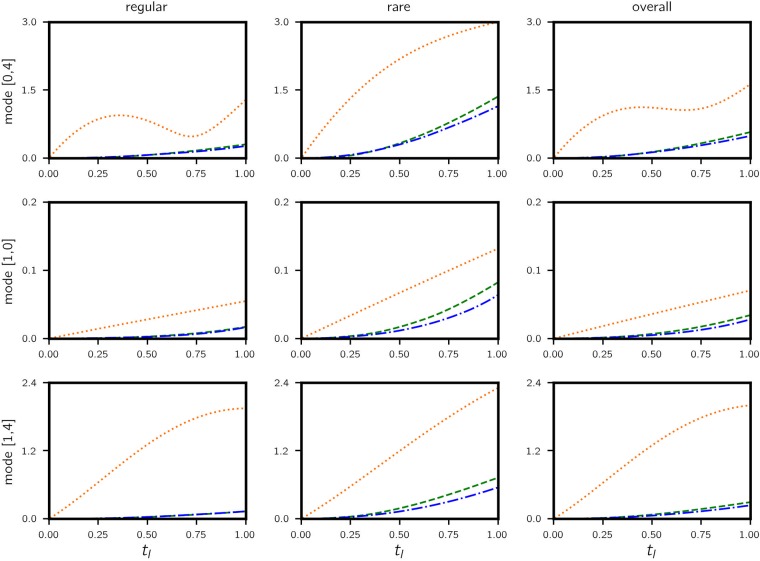
Fig 6. Kolmogorov flow—RMSE vs. time.
Errors are computed for 104 test trajectories (legend: fully data-driven—green dashed; data-assisted—blue dashdotted; triad—orange dotted). The RMSE in each mode is normalized by the corresponding amplitude . A test trajectory is classified as regular if |a(1, 0)| > 0.4 at t = 0 and rare otherwise. Performance for regular, rare and all trajectories are shown in three columns. Data-assisted model has very similar errors to those of purely data-driven models for regular trajectories, but the performance is visibly improved for rare events.

