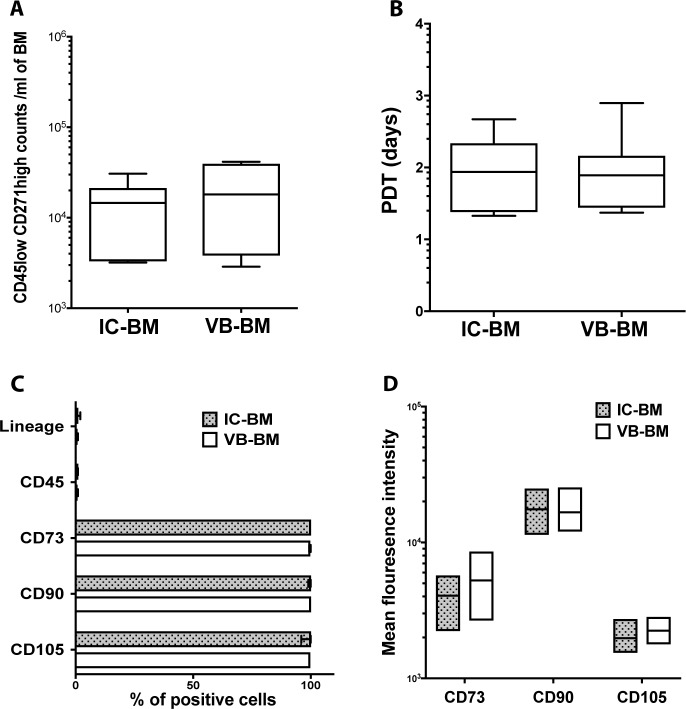
Fig 2. Abundance, proliferation and phenotype of VB-BM versus IC-BM MSCs.
A. The numbers of CD45low CD271high cells in unprocessed IC-BM and VB-BM aspirates (means are shown, Paired t-test, n = 6). B. The population doubling time (PDT) for VB-BM versus IC-BM MSCs (means are shown, Paired t-test, n = 7). C. The percentage of culture-expanded VB-BM MSCs versus IC-BM MSCs expressing hematopoietic lineage markers (CD34, CD14, CD19, HLA-DR), CD45, CD73, CD90, and CD105 (n = 3). The means of percentages are shown with bars of the standard error of the mean. D. The mean fluorescence intensity of positive markers expressed on VB-BM and IC-BM MSCs (n = 3).

