Figure 7.
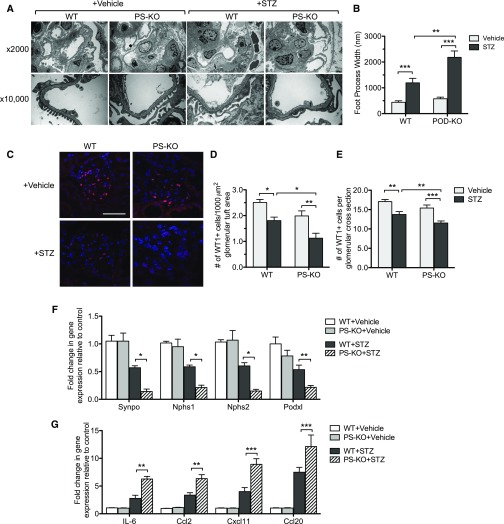
Podocyte injury and loss are worsened in diabetic PS-KO mice. (A) Representative transmission electron microscopy images of vehicle- or STZ-injected WT and PS-KO kidneys are shown at low (×2000) and high (×10,000) magnifications. (B) Quantification of foot process effacement is shown. (C) Representative images of WT-1 immunostained glomeruli are shown. (D and E) Quantification of WT-1+ cells are shown as (D) WT-1+ cell number per glomerular cross section and as (E) WT-1+ cell number per 1000 µm2 glomerular tuft area. (F) mRNA levels of WT-1, nephrin, synaptopodin, and podocin are shown as a relative fold change to vehicle control. (G) mRNA levels of inflammatory markers from isolated glomeruli are shown as a relative fold change to vehicle control. (60 glomeruli per group; n=6; *P<0.05, **P<0.01, and ***P<0.001 when compared between indicated groups.)

