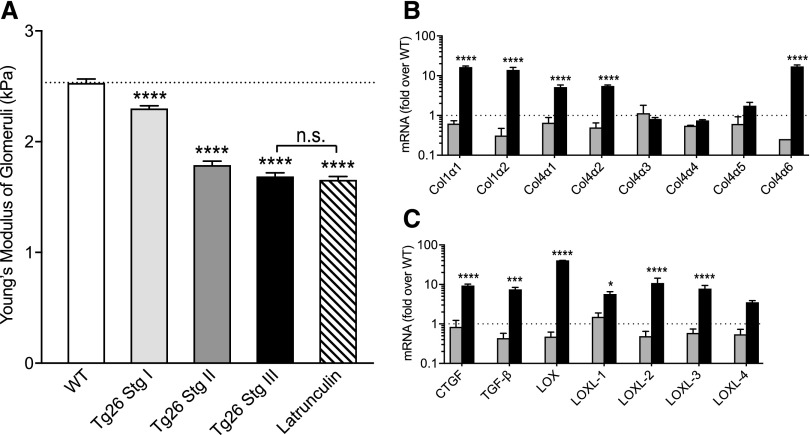
Figure 2.
Comparison of glomerular E and gene expression changes over the course of HIV nephropathy. (A) Comparison of the E values for the normal WT and stages 1–3 Tg26 glomeruli (mean±SEM; for the WT, 2.3±0.04 kPa [n=23]; for stage 1, 2.2±0.05 kPa [n=51]; for stage 2, 1.88±0.10 kPa [n=25]; for stage 3, 1.58±0.09 kPa [n=12]; and for latrunculin 0.5 μm, 1.5±0.15 kPa [n=5]). Comparable stiffness of stage 3 latrunculin-treated glomeruli shows the extent of loss of glomerular structural integrity in stage 3 Tg26. ****P<0.001 compared with the WT by ANOVA followed by Tukey multiple comparisons test. (B and C) Quantitative RT-PCR measurement of selected mRNAs relevant to fibrosis and scarring from stage 2 (dark gray) and stage 3 (black) glomeruli. Levels are fold differences over the WT normal glomeruli, and they are expressed as fold change from internal glyceraldehyde-3-phosphate dehydrogenase control. Values are mean±SEM (n=3 or 4 for each bar). *P<0.05 by two-way ANOVA followed by the Sidak multiple comparisons test; ***P<0.001 by two-way ANOVA followed by the Sidak multiple comparisons test; ****P<0.0001 by two-way ANOVA followed by the Sidak multiple comparisons test.

