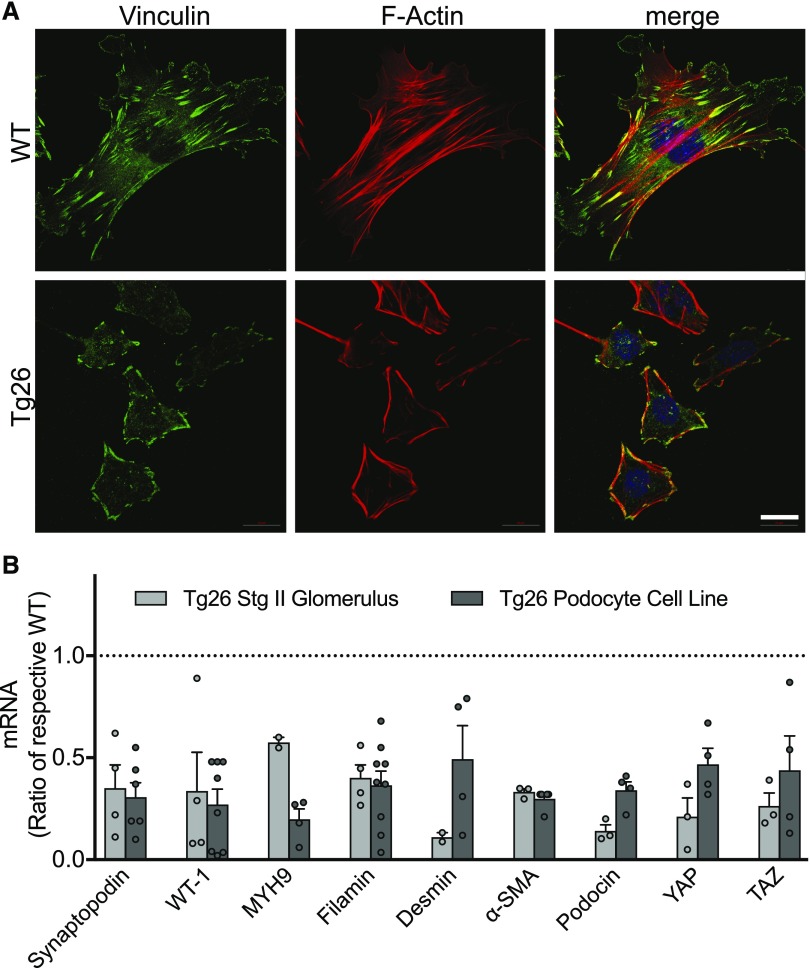
Figure 3.
Structure of normal and Tg26-cultured podocytes and expression of selected mRNAs. (A) Representative images of normal WT and Tg26 podocytes stained for F actin with rhodamine phalloidin (red) and vinculin (green) to identify focal adhesions and 4′,6-diamidino-2-phenylindole (blue) to identify nuclei. Scale bar, 20 μm. (B) Quantitative RT-PCR measurements of mRNA levels in stage 2 Tg 26 glomeruli (gray) or the Tg29 podocyte cell line (black). Levels are fold differences over normal WT glomeruli or the WT podocyte cell line, and they are expressed as fold change from internal glyceraldehyde-3-phosphate dehydrogenase control. Values shown are mean±SEM. All bars are significantly lower than respective WT controls; P<0.05 by ANOVA followed by the Dunnett multiple comparisons test.

