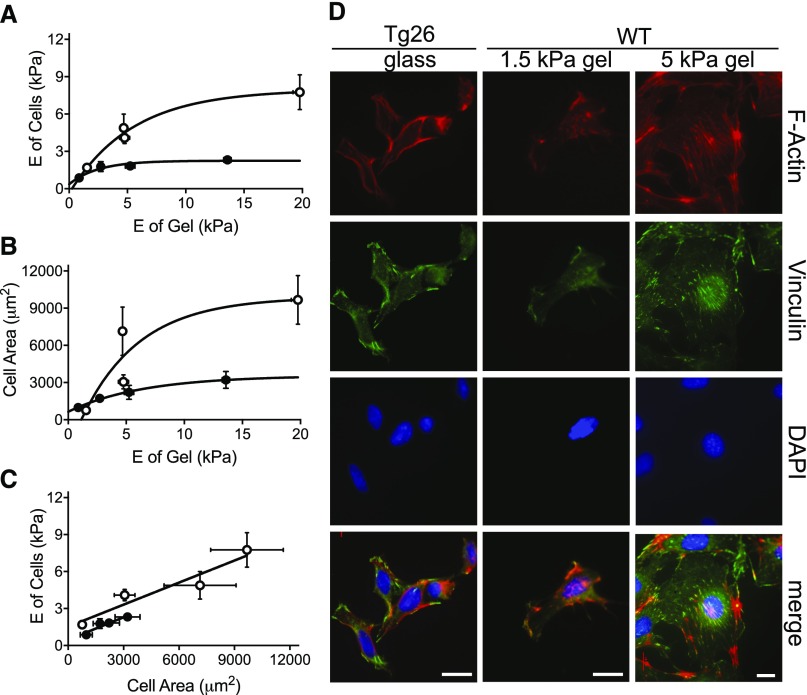
Figure 4.
Defective mechanosensing and responsiveness of Tg26 podocytes grown on collagen-coated polyacrylamide gels of defined E value. (A) The stiffening response of normal (white circles) and Tg26 podocytes (black circles) as a function of matrix stiffness. Cells were grown on type 1 collagen–coated acrylamide gels ranging in E value from 0.3 to 20 kPa. The E of each cell was measured using atomic force microscopy (AFM; six to eight measurements), and the region of matrix around the cell was also measured (six to eight measurements). WT podocytes reach a maximum E of 7.7±1.4 kPa on 19.8-kPa gels, whereas Tg26 podocytes achieve a maximum E of 2.1±0.3 kPa on 13.6-kPa gels. Horizontal error bars represent mean values of matrix E ±SEM, and vertical error bars represent the mean E values of cells ±SEM. (B) The spreading response of normal (white circles) and Tg26 (black circles) podocytes as a function of matrix stiffness. Cells were grown on type 1 collagen–coated acrylamide gels as above. The area of each cell was measured using ImageJ (four to five measurements per cell), and the E of the region of matrix around the cell was measured with AFM (six to eight measurements). The area of WT podocytes was 9900±3500 μm2, whereas the area of Tg26 podocytes was 3500±700 μm2 at maximum gel stiffness values. Horizontal error bars represent mean values of matrix E ±SEM, and vertical error bars represent the area of multiple cells (n=30–50) in the region of gels, with E values shown on the y axis. (C) Comparison of WT and Tg26 podocyte cell stiffness as a function of area. Paired responses to matrix stiffness are compared to illustrate a broader dynamic range of cytoskeletal rearrangement in the WT. (D) Comparison of WT and Tg26 podocyte cell morphology changes in response to matrix stiffness. Tg26 podocytes plated on type 1 collagen–coated glass were compared with WT podocytes grown on collagen-coated polyacrylamide gels of 1.5 or 5 kPa. Cells were imaged by confocal microscopy for F actin (red), vinculin (green), and nuclei (4′,6-diamidino-2-phenylindole [DAPI]; blue). Representative images of WT cells grown on 5-kPa stiffness were reduced to fit extensively spread cells in comparatively sized panels. Scale bars, 18 μm.

